
Bitcoin: Two Out of Three Metrics Confirm Bearish Phase
Facts as of November 14

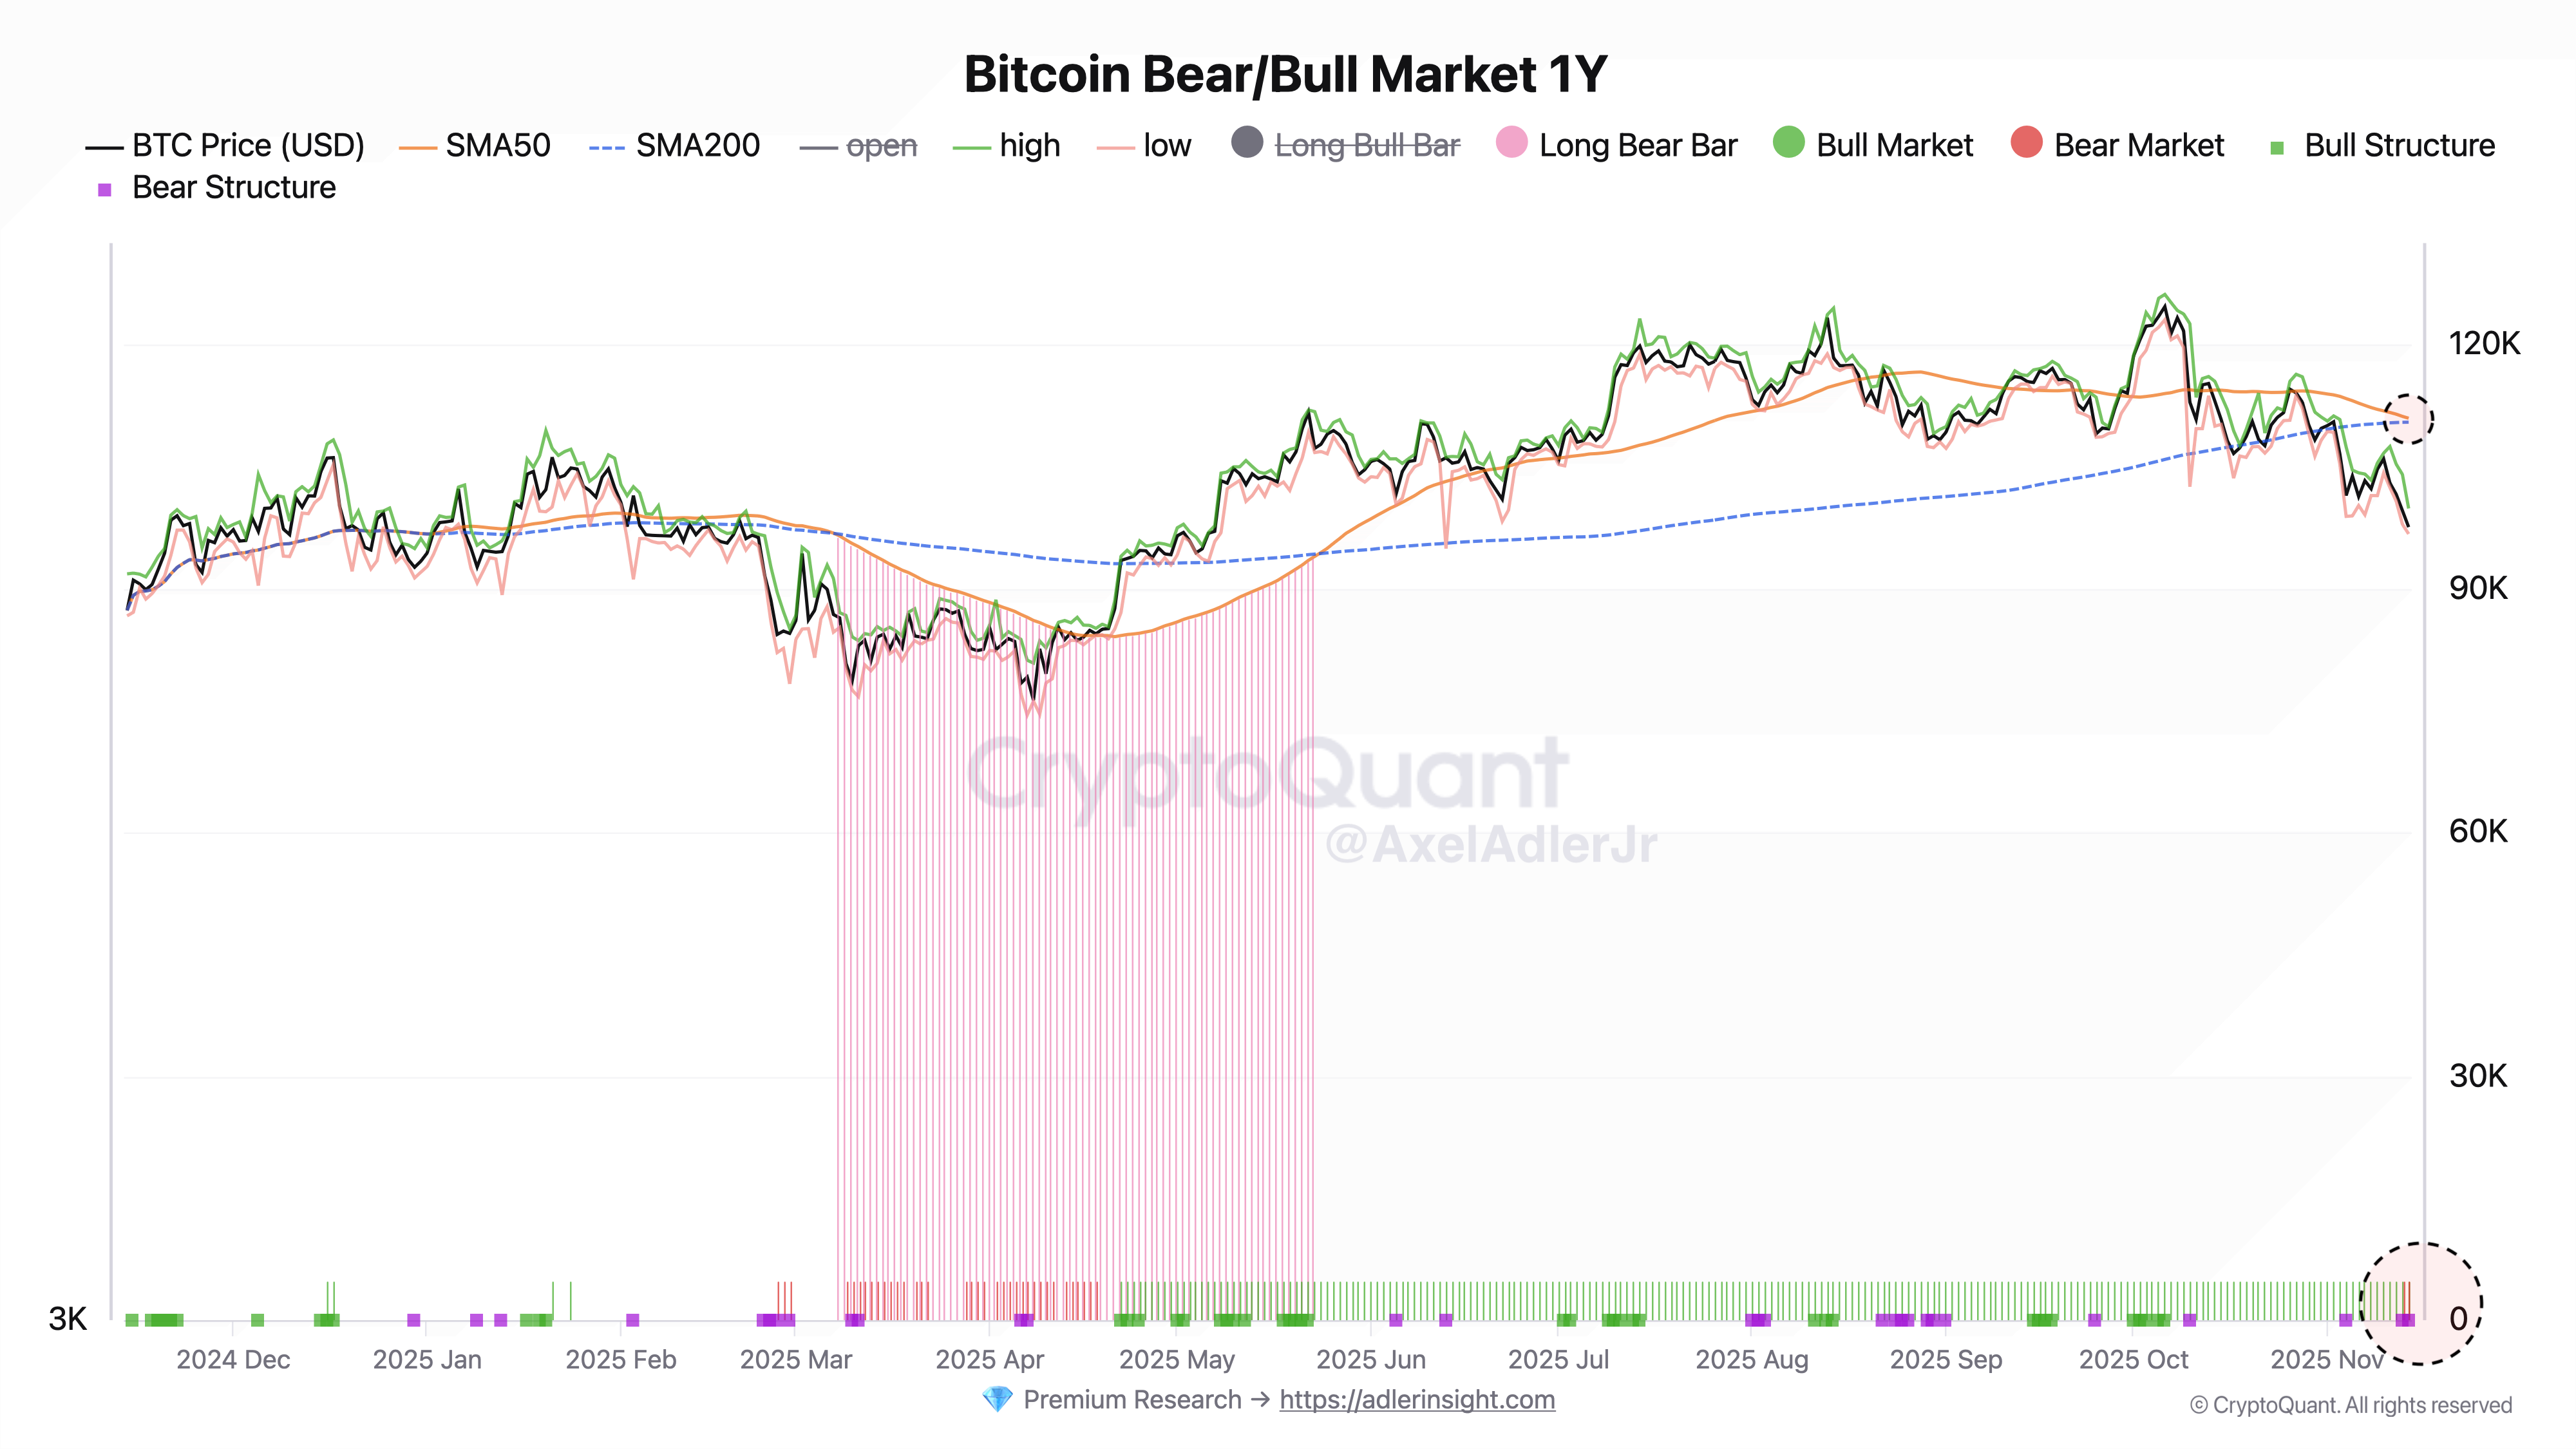
Bitcoin is trading at $97,578, which is 21.8% below the local maximum of $124,709 (October 6). According to the classic criteria for determining market regimes used by institutional players for the S&P 500, the BTC market has officially entered a bearish phase based on two out of three key metrics.
Calculations:
Trend relative to SMA200: BEARISH ✅
Price closed at $97,578 with SMA200 = $110,486. Bitcoin has been trading 11.7% below its 200-day moving average since November 7. This is a classic definition of a bear trend according to BlackRock, Goldman Sachs, and other major funds’ standards.Price Structure: BEARISH ✅
Since November 13, the daily chart has been forming a lower highs / lower lows pattern - a descending structure of highs and lows. This is a technical signal of a bear market used by Bank of America and Point72.Golden Cross hanging by a thread: SMA50 = $110,972 vs SMA200 = $110,486. The difference is only $486 (0.44%). Three days ago, the gap was $1,032. At the current pace, tomorrow or the day after, a Death Cross will occur (SMA50 will cross SMA200 from above), which will add a third bearish signal and paint the chart with a Strong Bear red bar.
Bottom Line:
Formally, the market regime is still classified as a “bull market” (+20% from the annual low of $76,276), but two out of three metrics are already bearish, and the third is on the verge of switching. If the Death Cross happens tomorrow, institutional models will unanimously show a bearish regime.
We’ll discuss the market in more detail in Sunday’s issue.
AAJ