
Weekly Engine #97
W4 May 2026

GM/GN.
In the middle of the week, Adler AM issue #173 touched on one of the key themes of the current market.
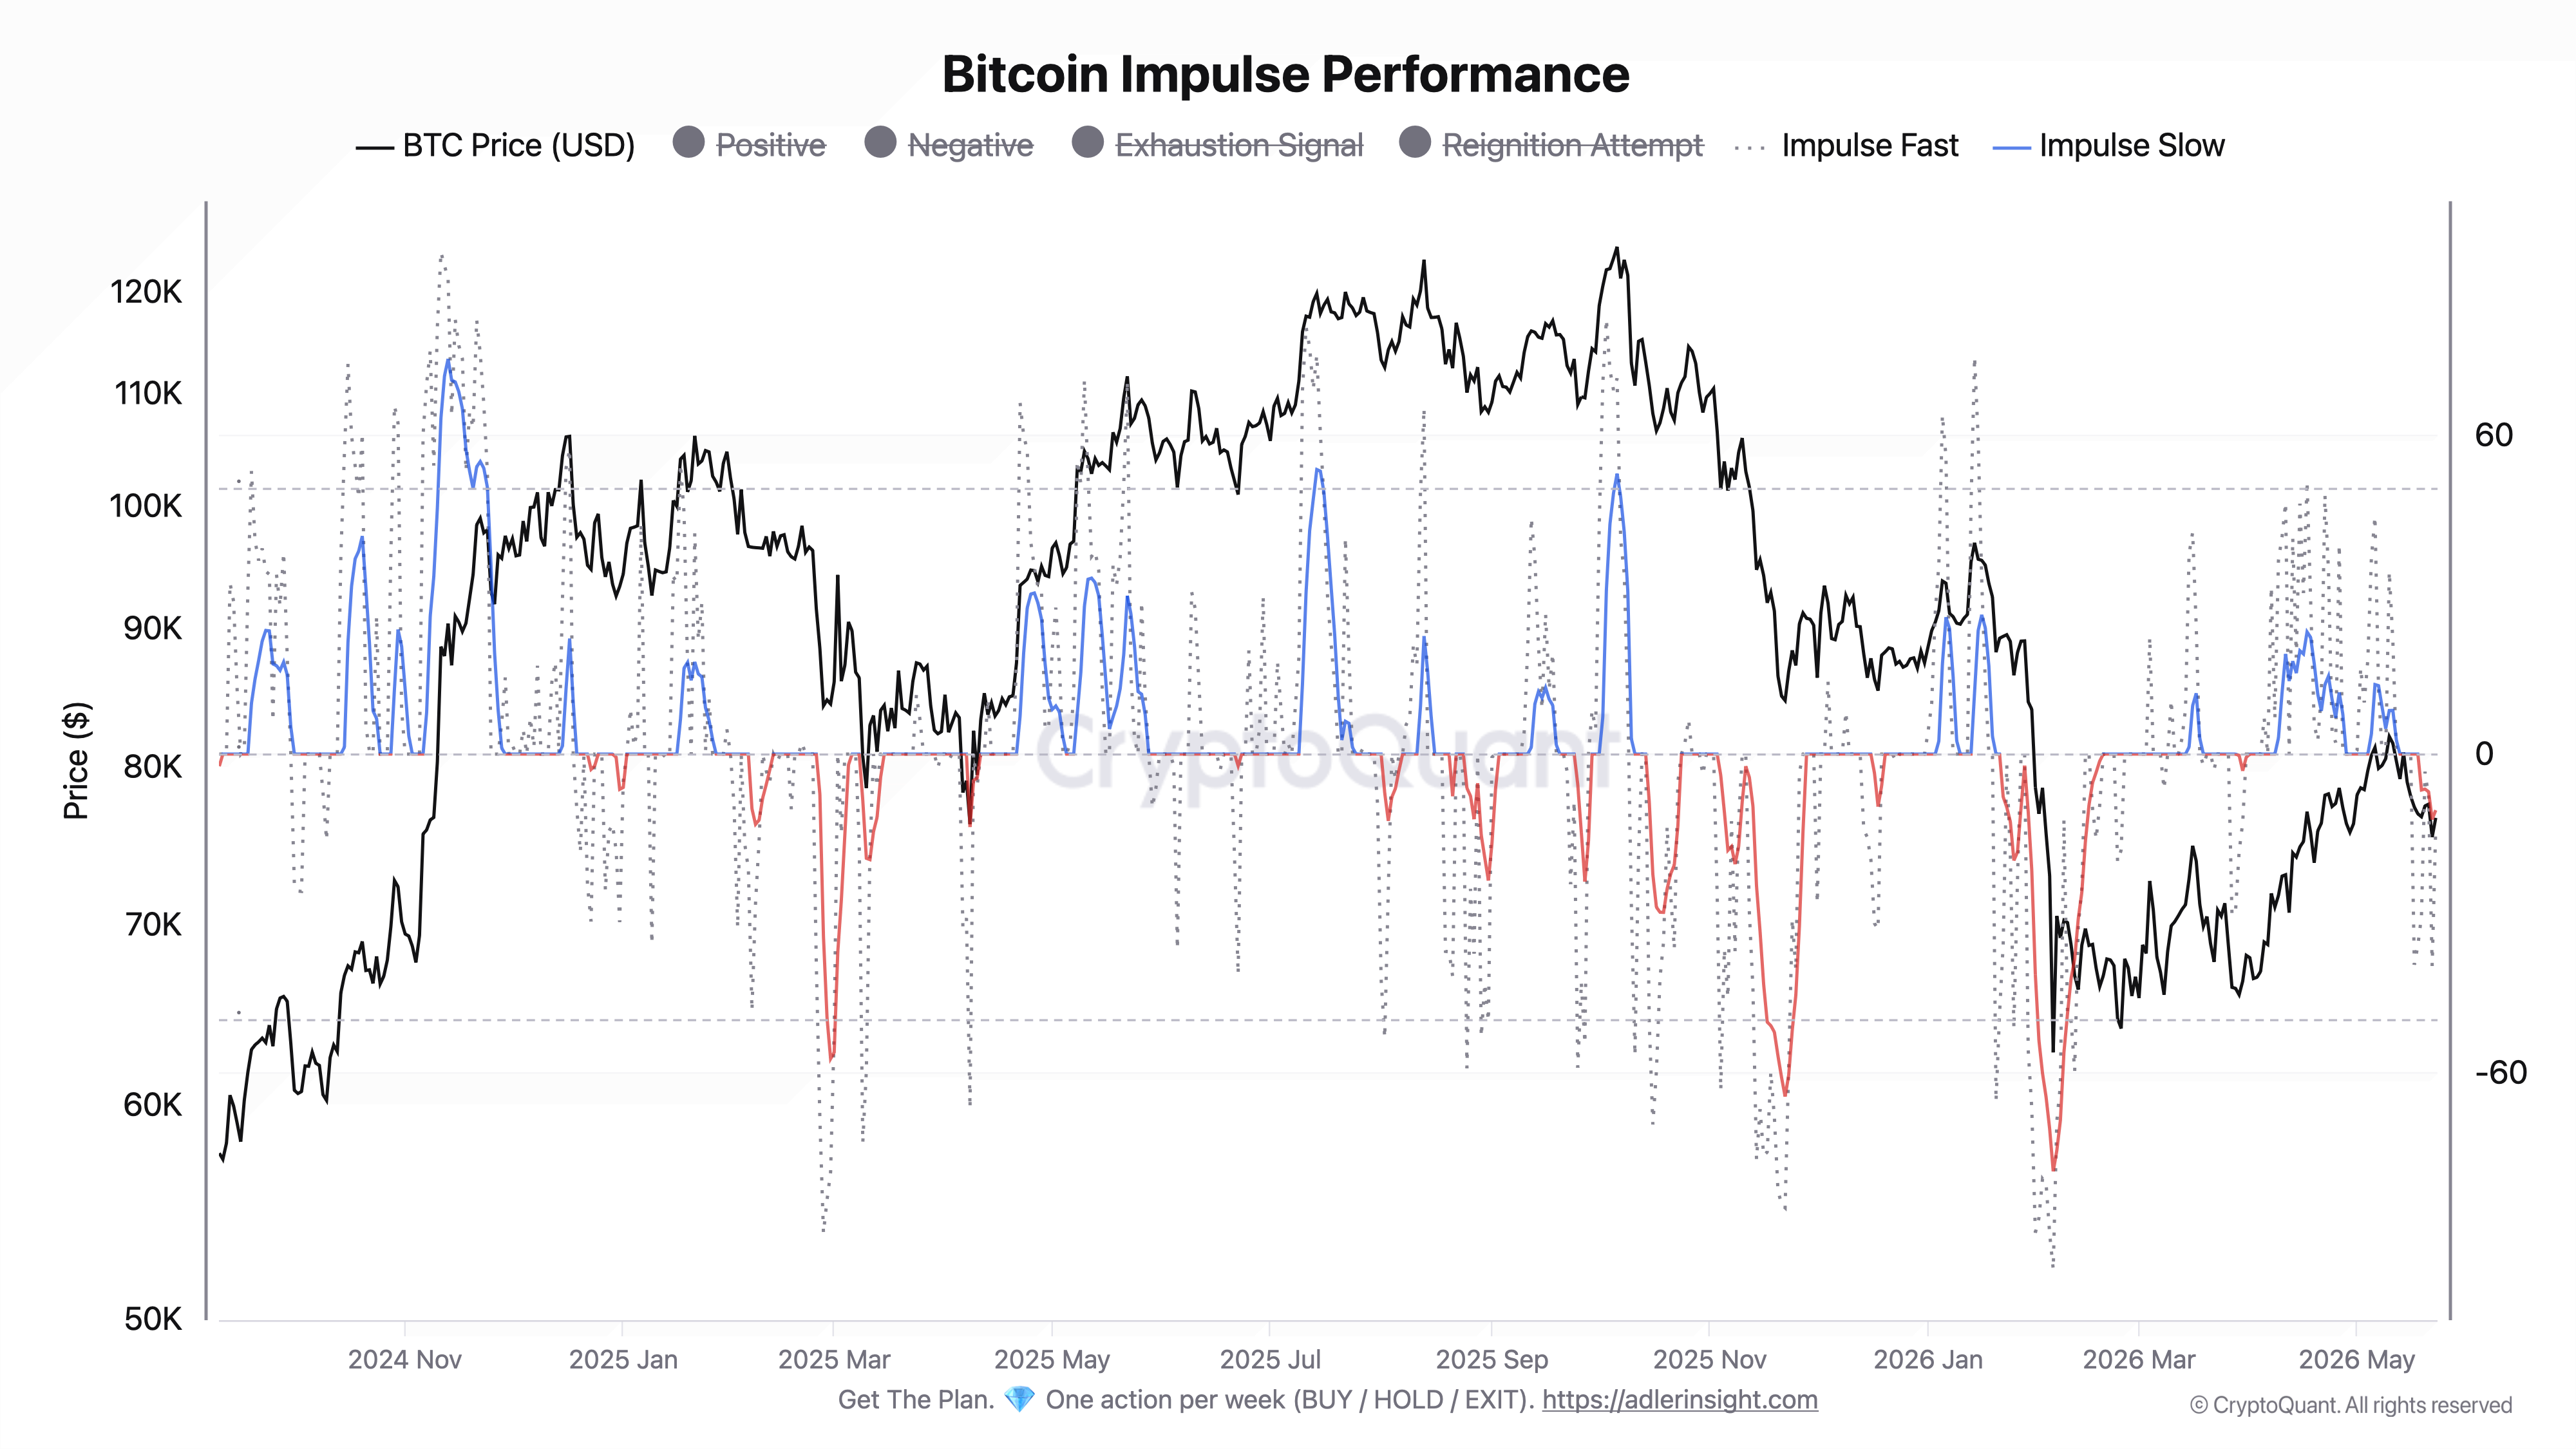
Bitcoin lost its structural bullish impulse exactly when the macro backdrop sharply deteriorated. This is an important signal: the market looks like a risk-off regime, where every BTC bounce remains unconfirmed until Impulse returns above zero.

That same week, Decision Architecture for Bitcoin | Part 4 was also published, where I break down the Macro Framework in detail, built on DXY, 10Y US Treasury Yield, and VIX.
The main idea of the issue: not every move in the dollar, yields, or volatility breaks the on-chain picture. But when macro truly switches on override mode, even a constructive on-chain setup can temporarily lose strength. This issue is especially relevant right now.
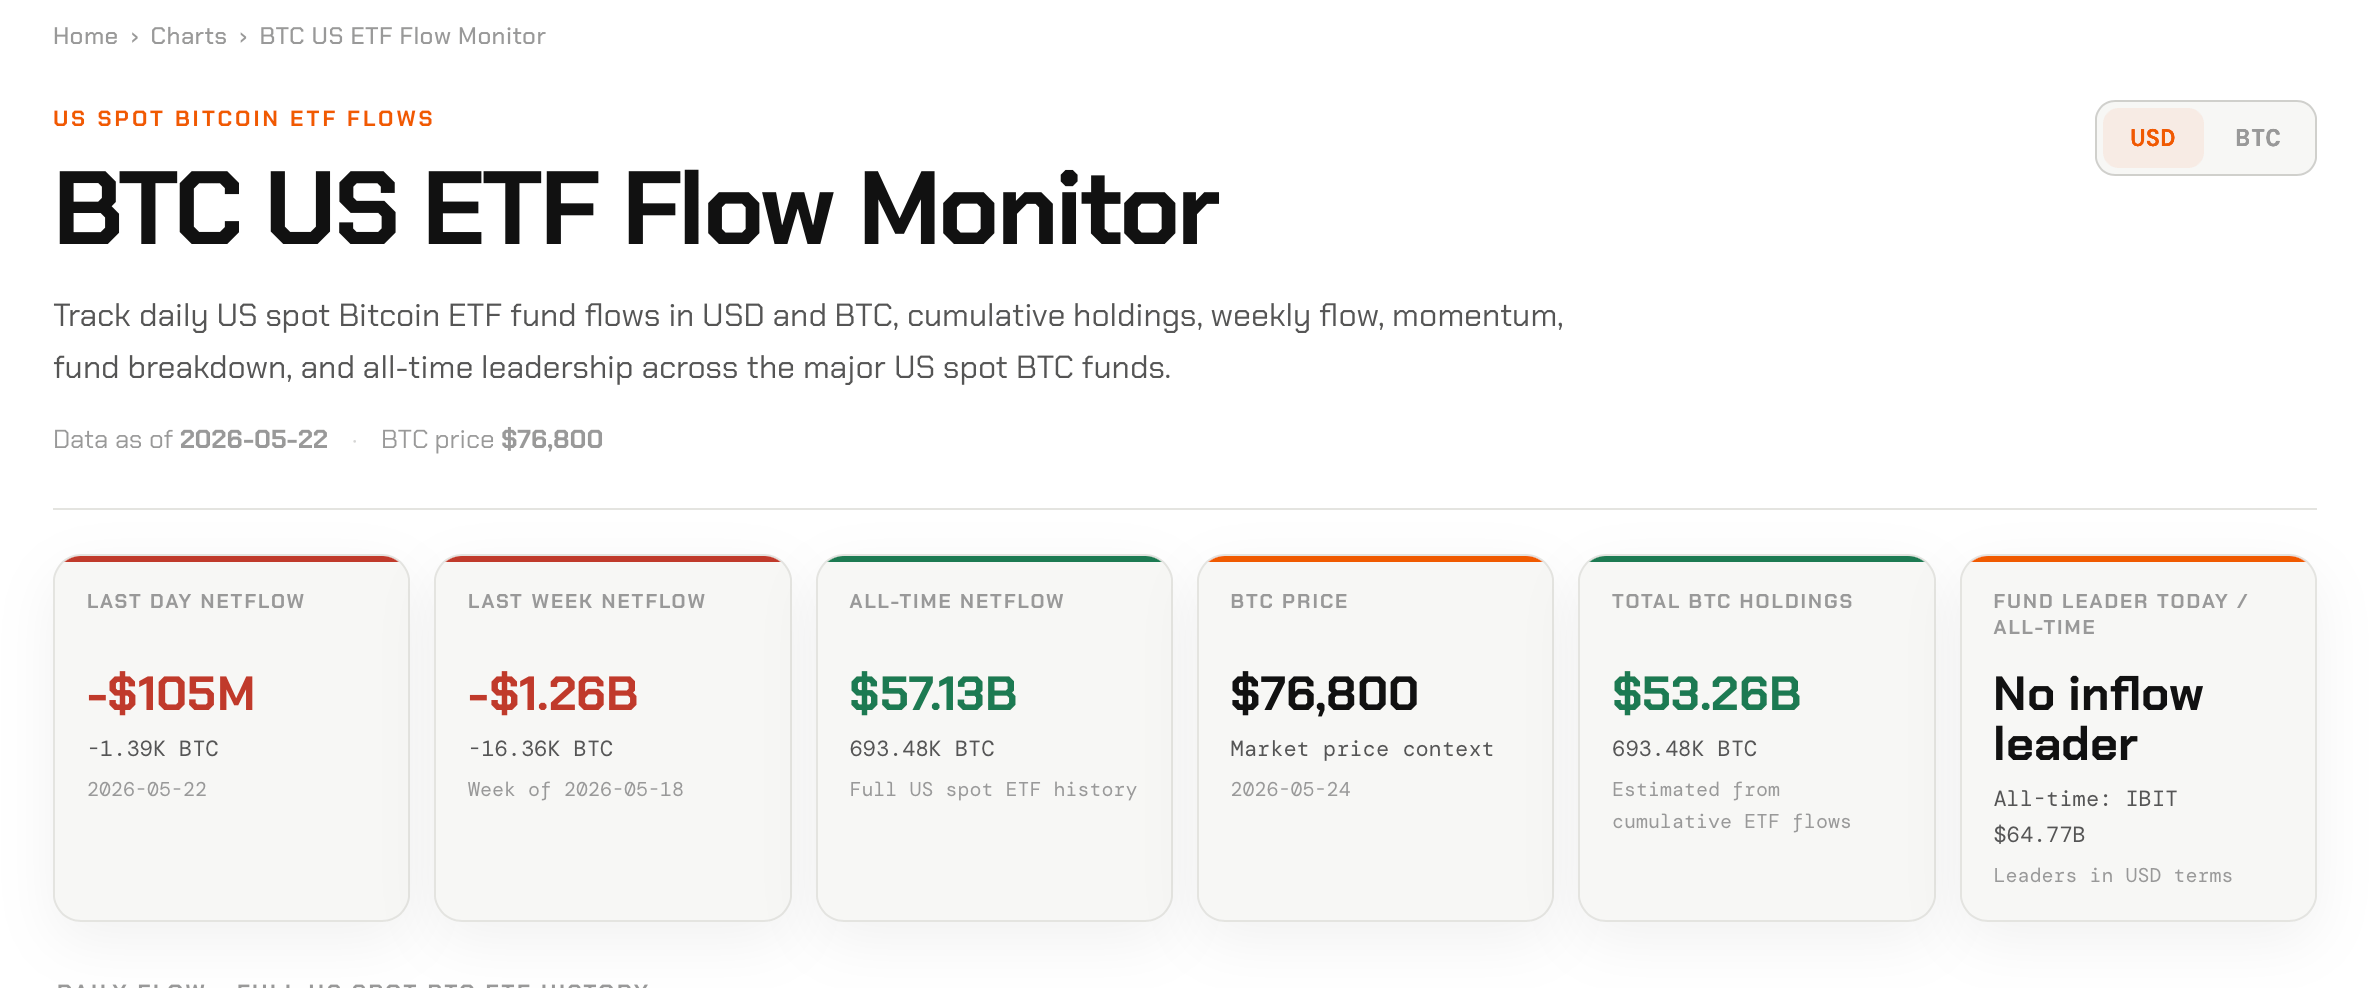
This week, we added a new dashboard for US Spot Bitcoin ETF. In addition to the main data on weekly net flow and cumulative flow, it includes additional charts on 30-day ETF Flow Momentum, demand dynamics over the last 4 weeks and flow distribution by each fund.
The main value of the dashboard is that it shows medium-term demand pressure from ETFs. Current momentum is now $362.8M, while the peak reached $13.21B in December 2024, and the low dropped to -$5.36B in November 2025.
This makes it easy to understand where ETF demand currently stands: in an accumulation phase, a cooling phase, or a structural outflow phase.
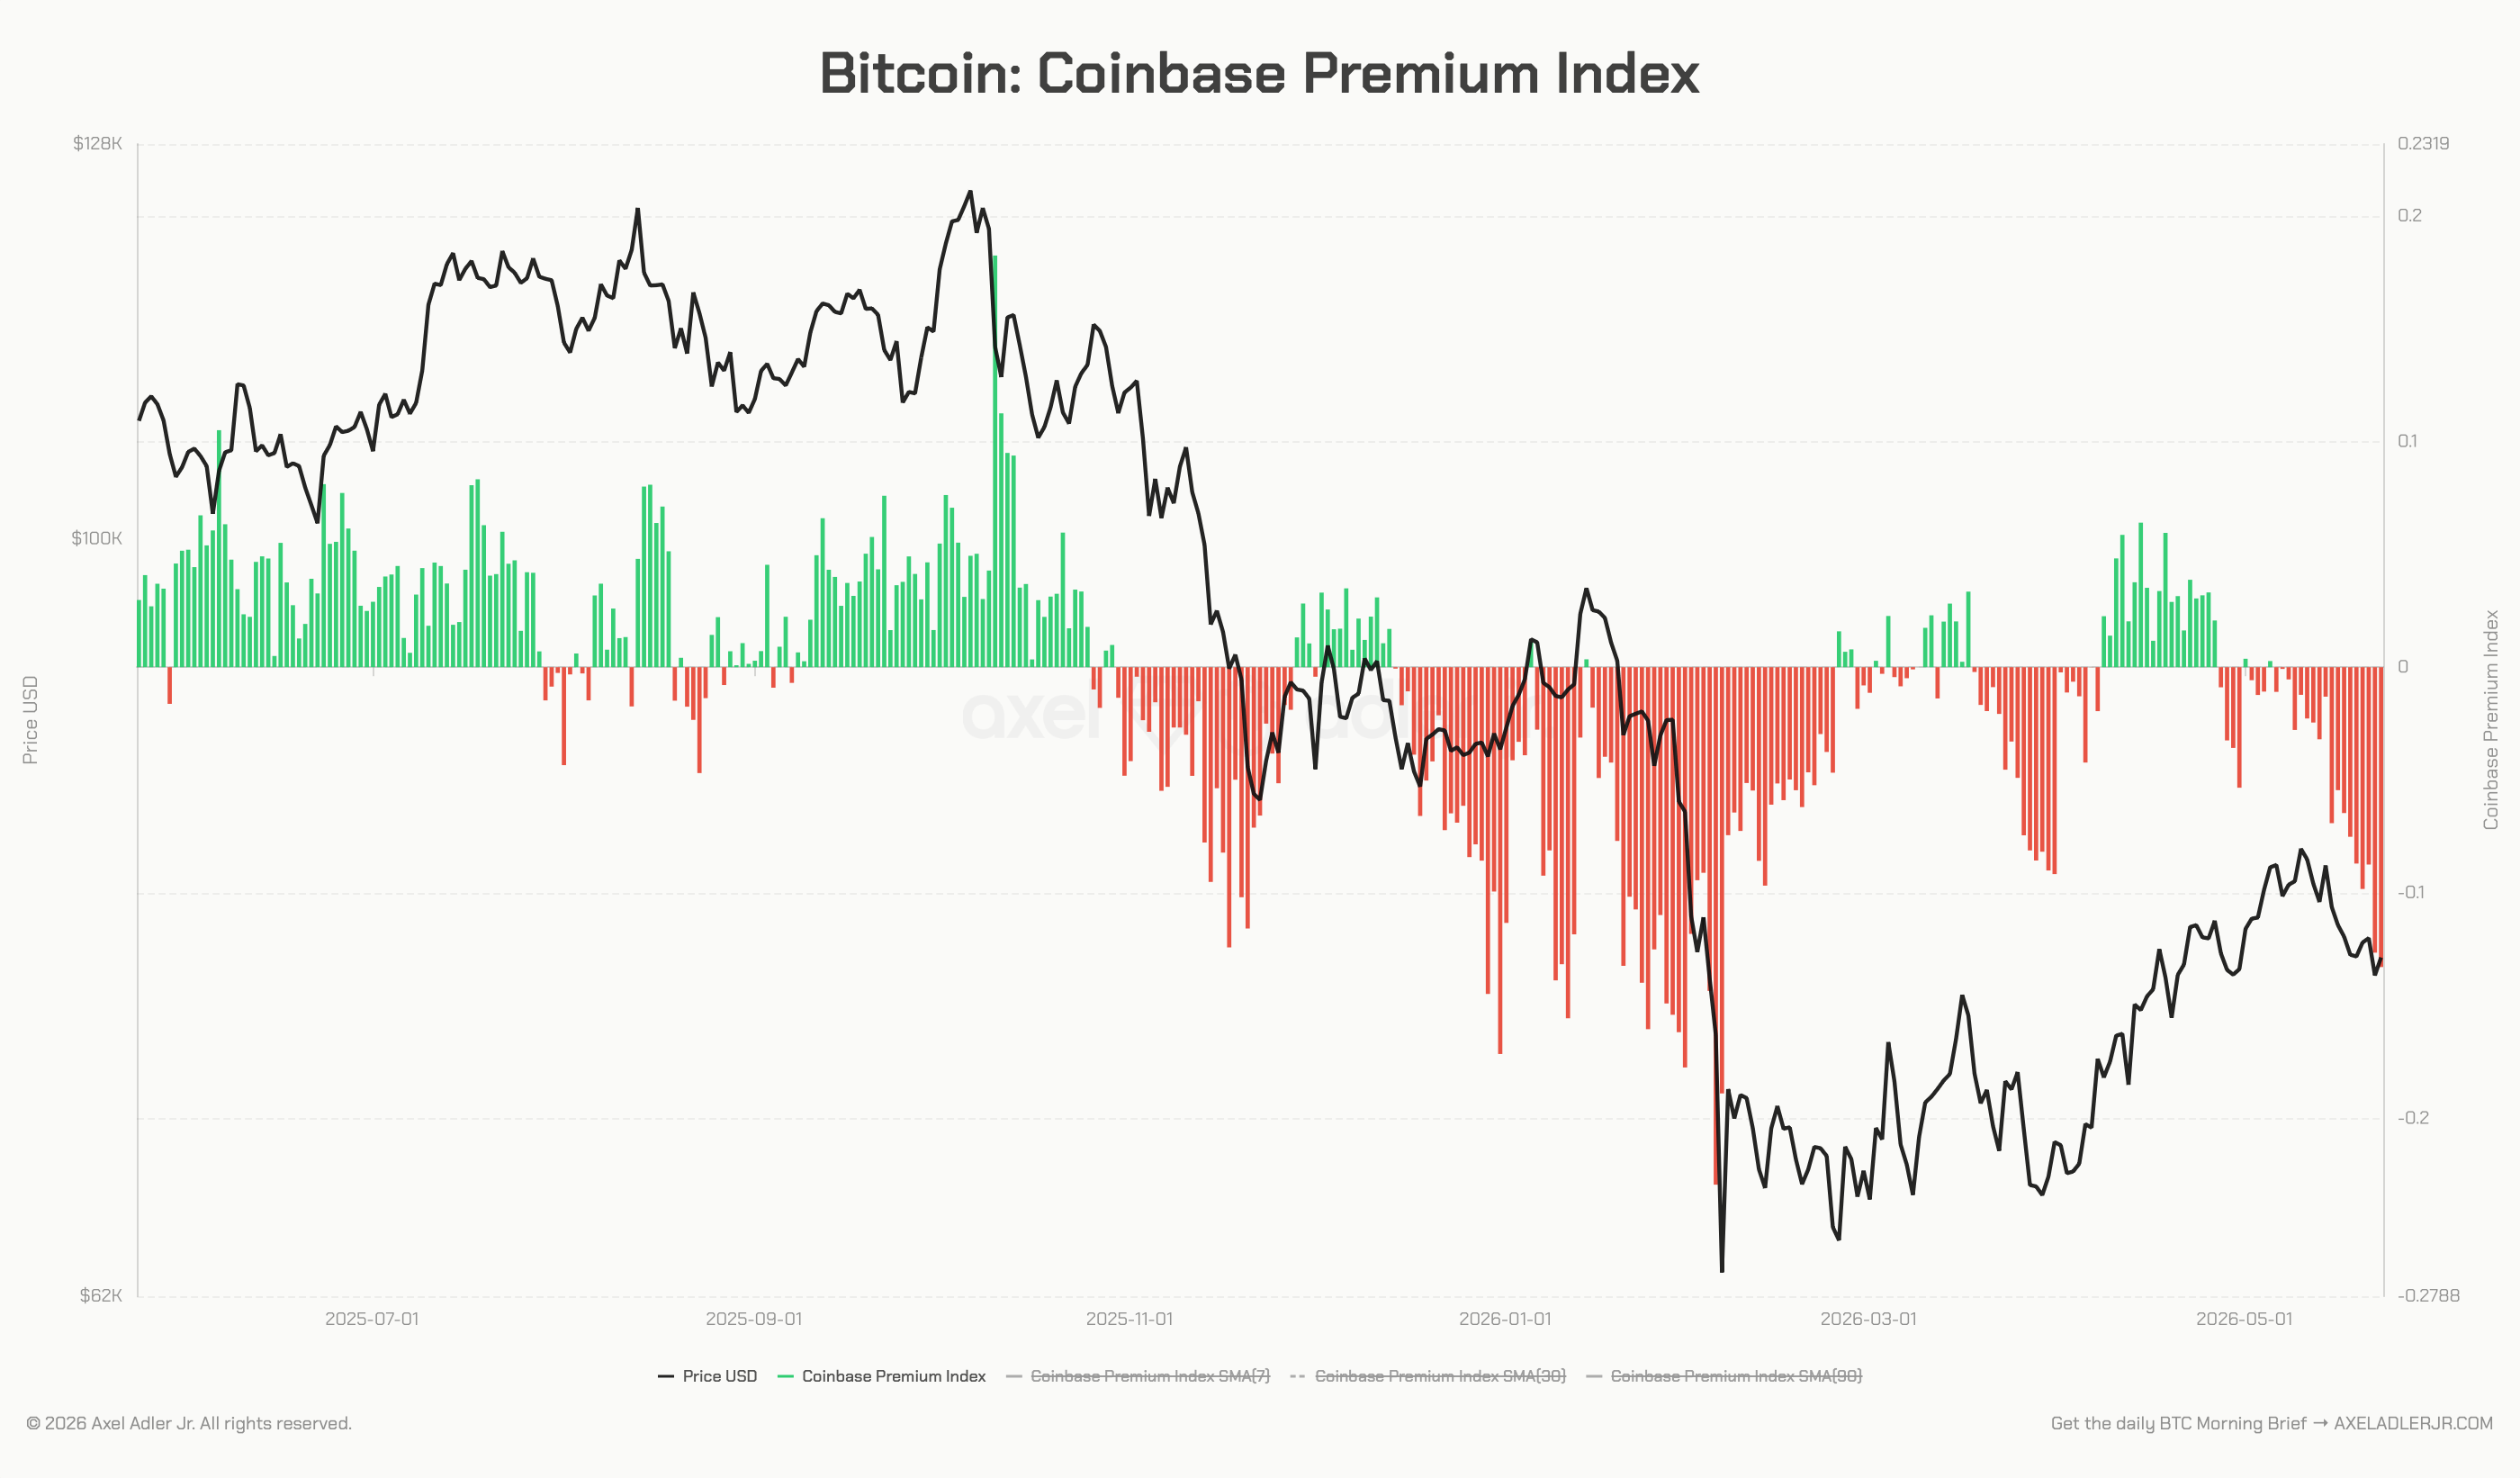
And of course, do not forget to check the Coinbase Premium Index - one of the key US Spot Demand Proxy indicators. If ETF flows show how institutional capital enters or exits through funds, Coinbase Premium helps reveal broader demand from the U.S. spot market.
When Premium holds sustainably above zero, it confirms the presence of US demand. When it moves into negative territory, even a BTC price increase becomes less reliable, because there may be no real American buyer behind the move.
Everyone looking at the chart from the past few days is asking the same question: should I buy, or is this a trap? Weekly Engine breaks the market down into seven layers and shows what is actually holding the price up, and what is ready to push it lower.
This week, the picture split in two and new constraints appeared that were not there just seven days ago. Let’s break this down.
Keep reading with a 7-day free trial
Subscribe to Adler Insight 💎 Premium to keep reading this post and get 7 days of free access to the full post archives.