


Bitcoin Trends – W2 August 2025
Consolidation at $118K, market compression, Max Pain $118K, exchange reserves growing, rotation to ETH

TL;DR:
TL;DR: BTC market compressed in the $116–118.7K range: momentum = 0%, compression at 8% level, Max Pain "magnet" $118K to expiration Aug 15. On-chain activity and hashrate declining with exchange reserves growing +12.9%, liquidity rotation to ETH pressuring dominance. Macro backdrop moderately bullish (weak DXY/Fed rate cut expectations), but tariff risks keep headline volatility elevated.

Macroeconomics for the past week
Priority: High
China: CPI (July) 0.0% y/y; core 0.8% y/y; +0.4% m/m
Conclusion: Inflation remains around zero: food weakness offset by non-food goods and services (partly due to subsidies and seasonal factors). Picture requires targeted demand support from authorities, but without obvious price pressure.China: PPI (July) −3.6% y/y; −0.2% m/m
Conclusion: 34th month of producer deflation signals soft domestic demand and pressure on industrial margins. For external markets this means low "imported" inflation and risk of price competition from Chinese exports.US: Dollar index (DXY) 98.2, week −0.8%, probability of Fed rate cut in next month 91%
Conclusion: Dollar weakening reflects strengthening bets on imminent Fed policy easing amid softer data. Financial conditions shift supports commodity assets and EM currencies, but tariff risks limit unambiguous "risk-on."Gold $3,400/oz (spot), NY futures - intraday record $3,534/oz, US introduces tariffs on standard bars
Conclusion: Combination of weak dollar, rate cut expectations and tariff news strengthens demand for "safe havens." Additional tariff factor may hit flows from Switzerland, but overall supports metal prices.US: Initial jobless claims 226k, continuing claims - 1.974M (max since 2021)
Conclusion: Labor market losing momentum: rising continuing claims indicates longer job search duration and strengthens arguments for softer Fed trajectory.
Priority: Moderate
US: Labor productivity (Q2, prelim.) +2.4% q/q
Conclusion: Productivity rebound restrains unit labor costs and helps services disinflation - this is "good" news for Fed and equity multiples.UK: Bank of England −25 bp to 4.0% (split 5–4)
Conclusion: Cautious turn toward easing amid sluggish growth and persistent inflation. Signal toward gradual cycle and heightened data sensitivity.US: Mortgage applications +3.1% w/w, 30-year rate fell 6 bp
Conclusion: Rate relief supported refinancing and purchase demand, but activity level remains "restrained" due to prices and supply.Eurozone: Retail sales (June) +0.3% m/m (< consensus)
Conclusion: Consumption recovering but without acceleration — growth momentum in region fragile, and tariff uncertainty remains headwind.
Summary
Mix: Chinese "flat" inflation with deep PPI deflation, soft US data and BoE turn toward rate cuts simultaneously weaken dollar and support "safe havens" (gold), but don't remove tariff risks. For markets this is equilibrium between hope for imminent Fed easing and threat of weaker global demand: short-term - mild support for bonds and partial rotation to defensive stories, for risk assets - selectivity and heightened sensitivity to data and tariff headlines.

Stock market for the past week
Priority: High
Tech sector pulled indices to new peaks (Friday: S&P 500 +0.8%, Nasdaq ~+1%, Dow +206 pts)
Conclusion: Rally led by mega-techs: Apple +4.2% on announcement of major US investment program, supporting risk appetite and strengthening growth leadership.Fed easing expectations strengthened
Conclusion: Stephen Miran's appointment to Fed Board reinforced market bet on softer policy course. Despite tariff risks, rate curve and beta sectors reacted "risk-on."
Priority: Moderate
Corporate drivers (earnings/guide): Gilead and Monster +6%+, Expedia +4%, Tesla +2.3%, Intel +0.9%.
Conclusion: Mix of strong reports and improved guidance supported market breadth, but sensitivity to tariff headlines for tech and consumer sectors remains high.Tariff overhang persists
Conclusion: Optimism on rates and earnings outweighs for now, however threats of expanded tariffs - key source of headline volatility and rotation to defensive stories on negative news.
Week Summary
S&P 500 +2.4%
Nasdaq +3.9% (record closes two days in a row)
Dow Jones +1.4%
Momentum driven by mega-techs and "rate" expectations; market breadth improved on positive earnings backdrop.
Next week
Trade/geopolitics: tracking US–China progress until August 12 (risk of higher tariffs), possible US–EU meeting, expected Trump–Putin meeting.
US (data): CPI, PPI, retail sales, industrial production, preliminary Michigan Sentiment.
US earnings: mega-caps and major names continue the season.
Global: China (industrial production, retail, credit); Eurozone GDP, ZEW (Germany); Japan GDP (Q2); India/Brazil inflation; intensive UK block (GDP, labor market, industrial production, trade); RBA decision.
Brief on risks/positioning: Base tone remains "moderately bullish" supported by earnings and Fed easing, but tariff and geopolitical shocks can quickly amplify intraday drawdowns.
Week in brief: combination of "flat" inflation in China and deep PPI deflation, soft US block (rising continuing claims, DXY weakening) and Bank of England's cautious pivot formed moderately bullish backdrop. Mega-tech rally and gold records show classic mix of "rate" risk-on with hedge through "safe havens." Tariff overhang remains main source of headline volatility: it limits upside in cyclical/export-dependent stories and supports selectivity in risk.
For near-term horizon, base scenario - "mild support" for risk assets with neutral-positive US data (CPI/PPI/retail) and high probability of Fed rate cut, with leading dynamics in quality growth (mega-tech/AI).

Important news of the past week
Priority: High
ETH reached $4,300 for first time in 8 months amid treasury purchases, ~$5B inflow to ETFs and record on-chain activity, total ETH-ETF AUM grew to $20.66B.
SEC clarified staking regime: liquid staking not considered securities.
SEC updated accounting guidance: dollar stablecoins with guaranteed redemption may qualify as cash equivalents.
Two US presidential orders: (a) inclusion of crypto assets, private equity and alternatives in 401(k) plans; (b) prohibition of using "reputational risk" for de-facto refusal by banks to service crypto firms.
Harvard Management Company fund worth $53B disclosed $116M stake in BlackRock's Bitcoin ETF, being its fifth largest holding as of June 30, important mainstream signal.
BitMine became largest public ETH holder: 833,000 ETH (~$2.9B).
Priority: Moderate
SharpLink (Joe Lubin) bought 83,561 ETH for $304M, bringing reserves to 521,939 ETH (> $1.9B) - second largest corporate ETH portfolio.
Ethereum network transaction volume in July - $238B, maximum since 2021.
World Liberty Financial preparing Nasdaq listing for $1.5B treasury company for WLFI storage - MicroStrategy-style strategy.
CleanSpark: Q3 revenue +91% to $198.6M, net profit $257.4M, BTC treasury > $1B at 50 EH/s hashrate.
SEC and Ripple withdrew appeals, finalizing XRP case while preserving 2023 decision; XRP rose ~7%.
Priority: Low
Ether Machine bought 10,605 ETH (~$40M), GameSquare added 2,717 ETH (~$10M) - expansion of corporate ETH treasuries.
Metaplanet acquired 463 BTC for $53.7M, bringing balance to 17,595 BTC (~$1.78B) and maintaining 7th place among public BTC holders.
Conclusions
Regulatory clarity in US (SEC position on staking and stablecoins + presidential orders on 401(k) and banking services) removes key compliance risks and opens floodgates for institutional capital. Against this backdrop ETH stands out: sustained ETF inflows, record network activity and growing corporate treasuries (BitMine, SharpLink) strengthen bullish thesis and spot support.
Simultaneously, systemic institution participation (Harvard, WLFI treasury Nasdaq listing) cements asset class legitimacy, while strong miner reports (CleanSpark) show infrastructure players adapted to new price and regulatory regimes. Overall picture - accelerating crypto asset integration into traditional finance with high probability of continued ETH inflows and corporate treasury diversification.

Bitcoin trading week macro analysis
1. BTC/USD pair analysis
Key indicators for the week
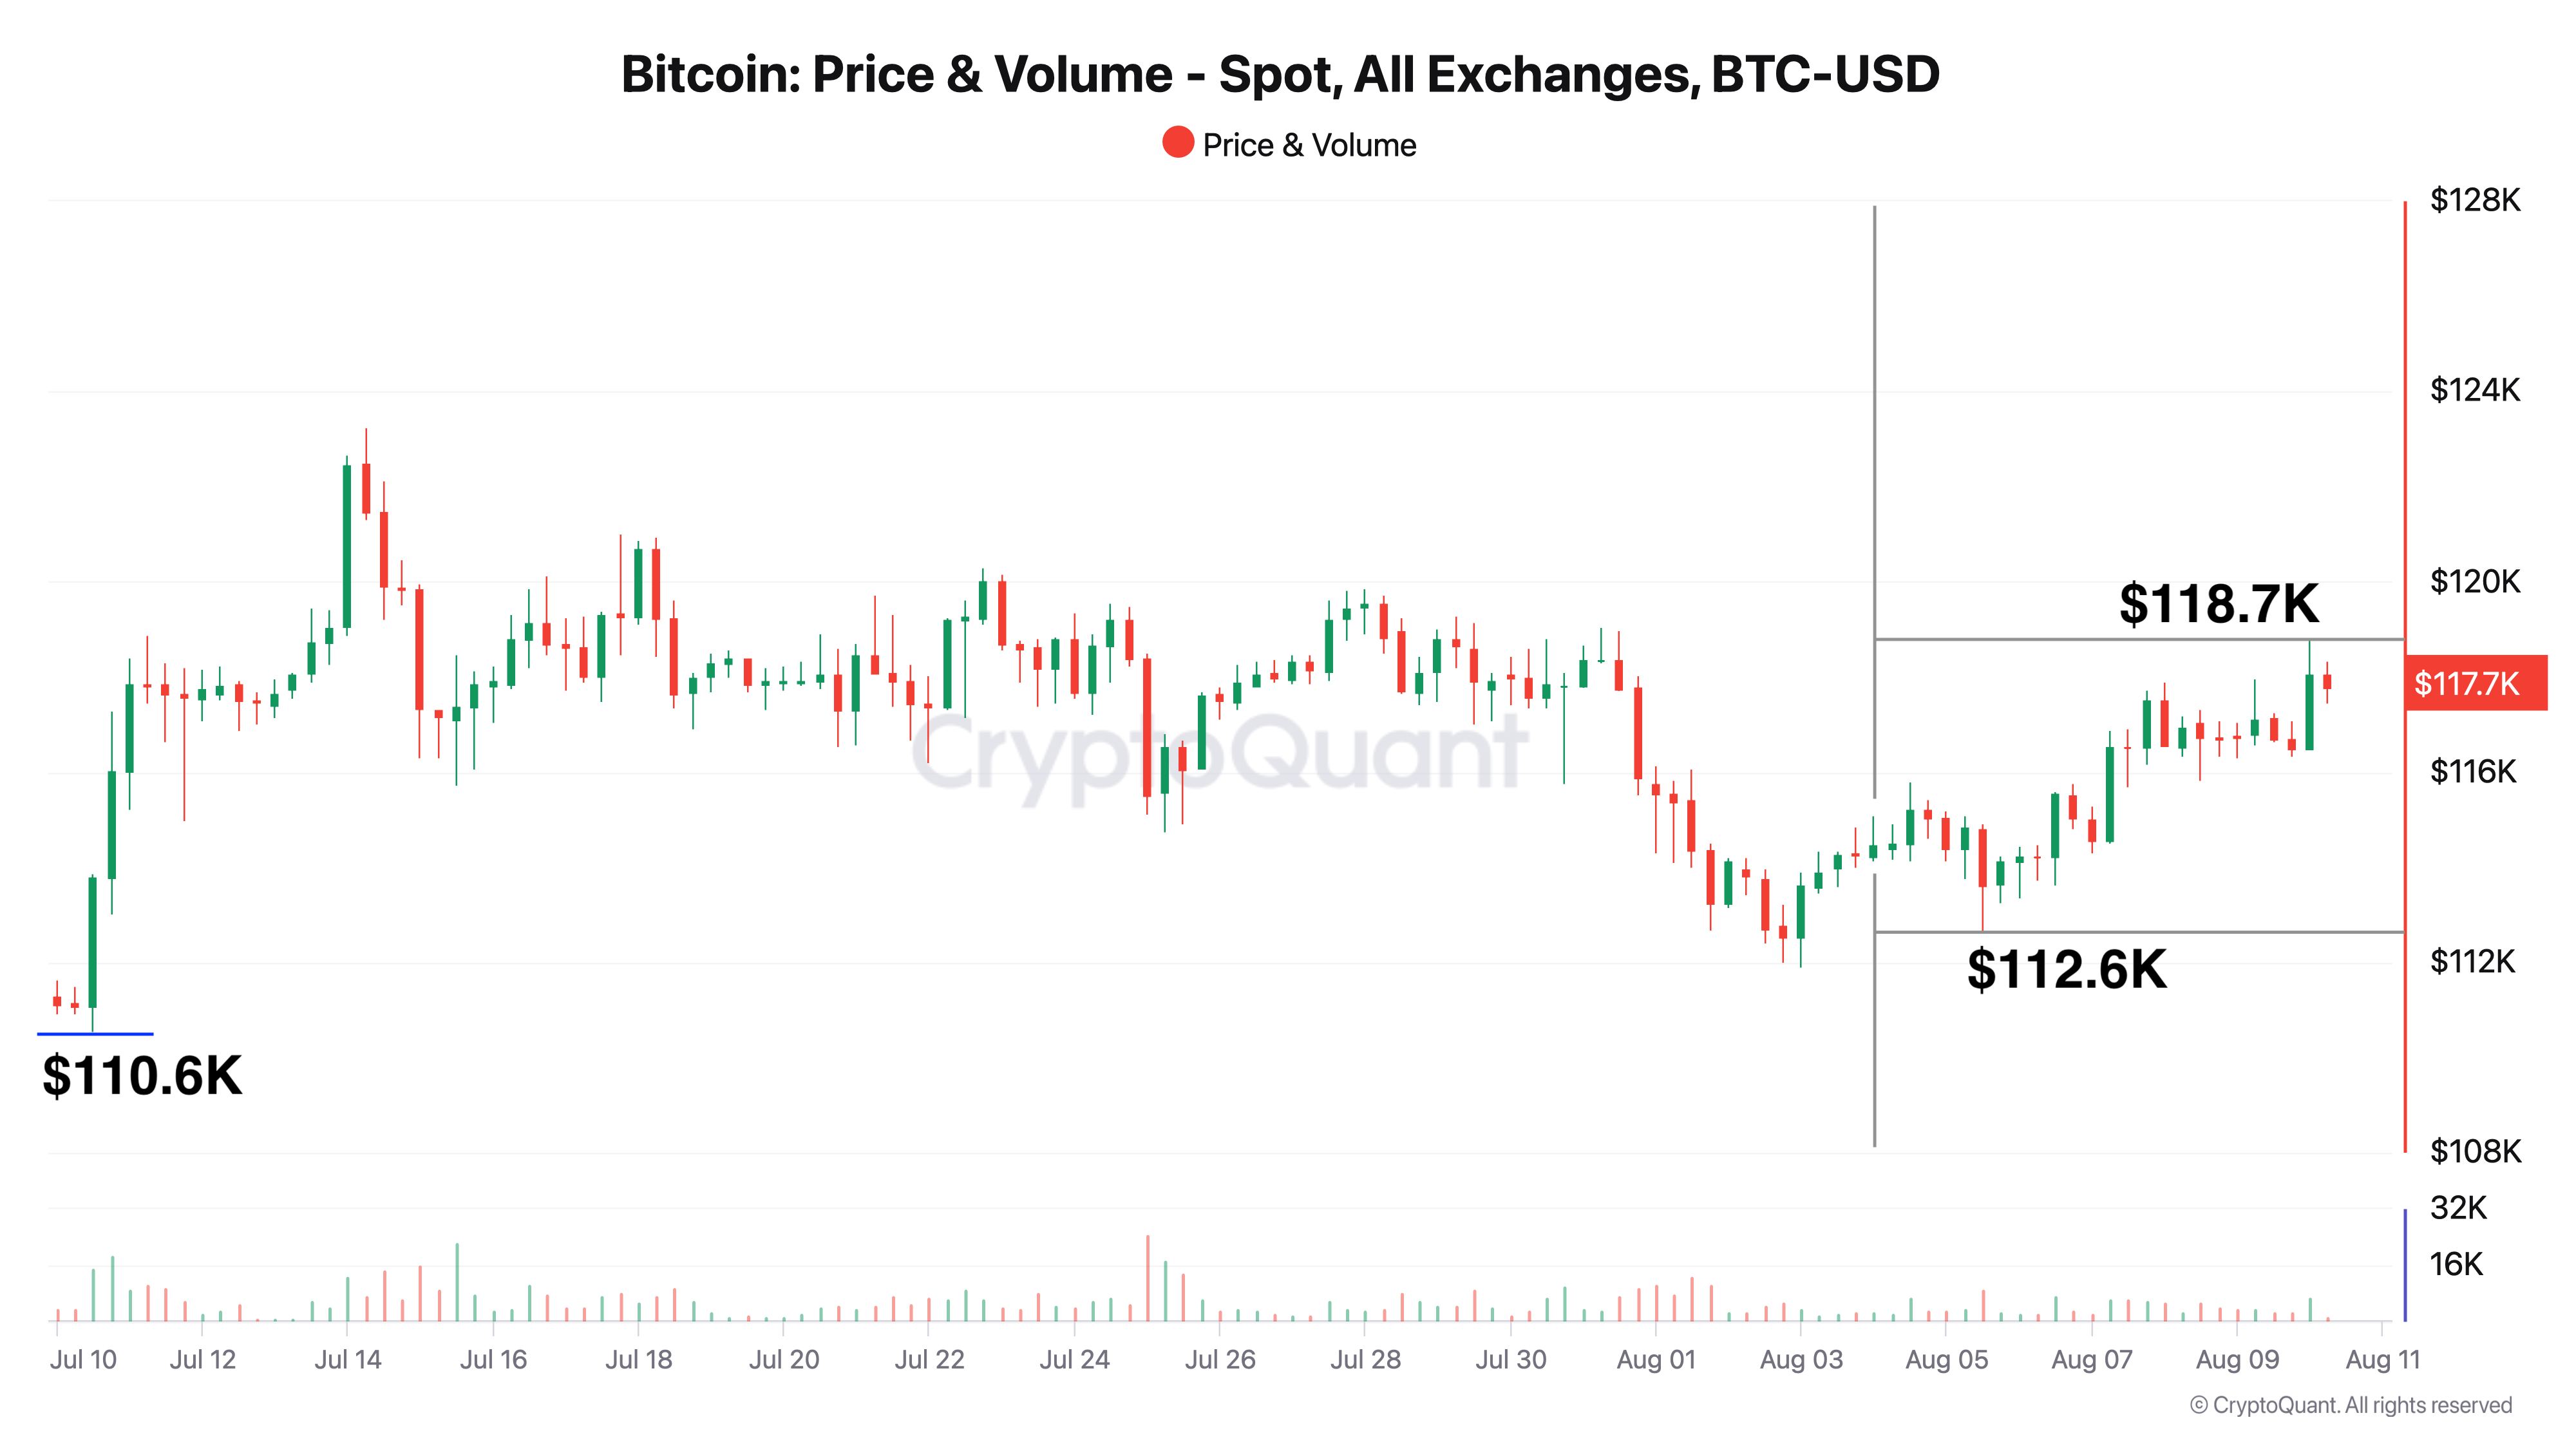
Current price: $117.7K
Local maximum: $118.7K
Local minimum: $112.6K
Trend
Early week BTC updated local minimum to $112.6K on elevated volumes, followed by sustained bounce with series of higher lows. Price returned to $116–$118K zone and by period end consolidated around $117–118K, where range narrowing and moderate volumes observed - signs of consolidation after recovery.
Drop to $112.6K accompanied by selling spike and quick absorption.
During rise activity gradually declined, typical for accumulation phase.
$116–$118K range became working balance zone before next impulse.
Conclusions
Key resistance: $118.7K - confident breakout on rising volumes opens path to $120–$122K.
Local support: $116K - level hold preserves bullish scenario; loss leads to $112.6K retest.
Strong base support: $110K - important anchor level, close below raises deeper correction risks.
2. Bitcoin Price Momentum (30-day)
Analysis for this week
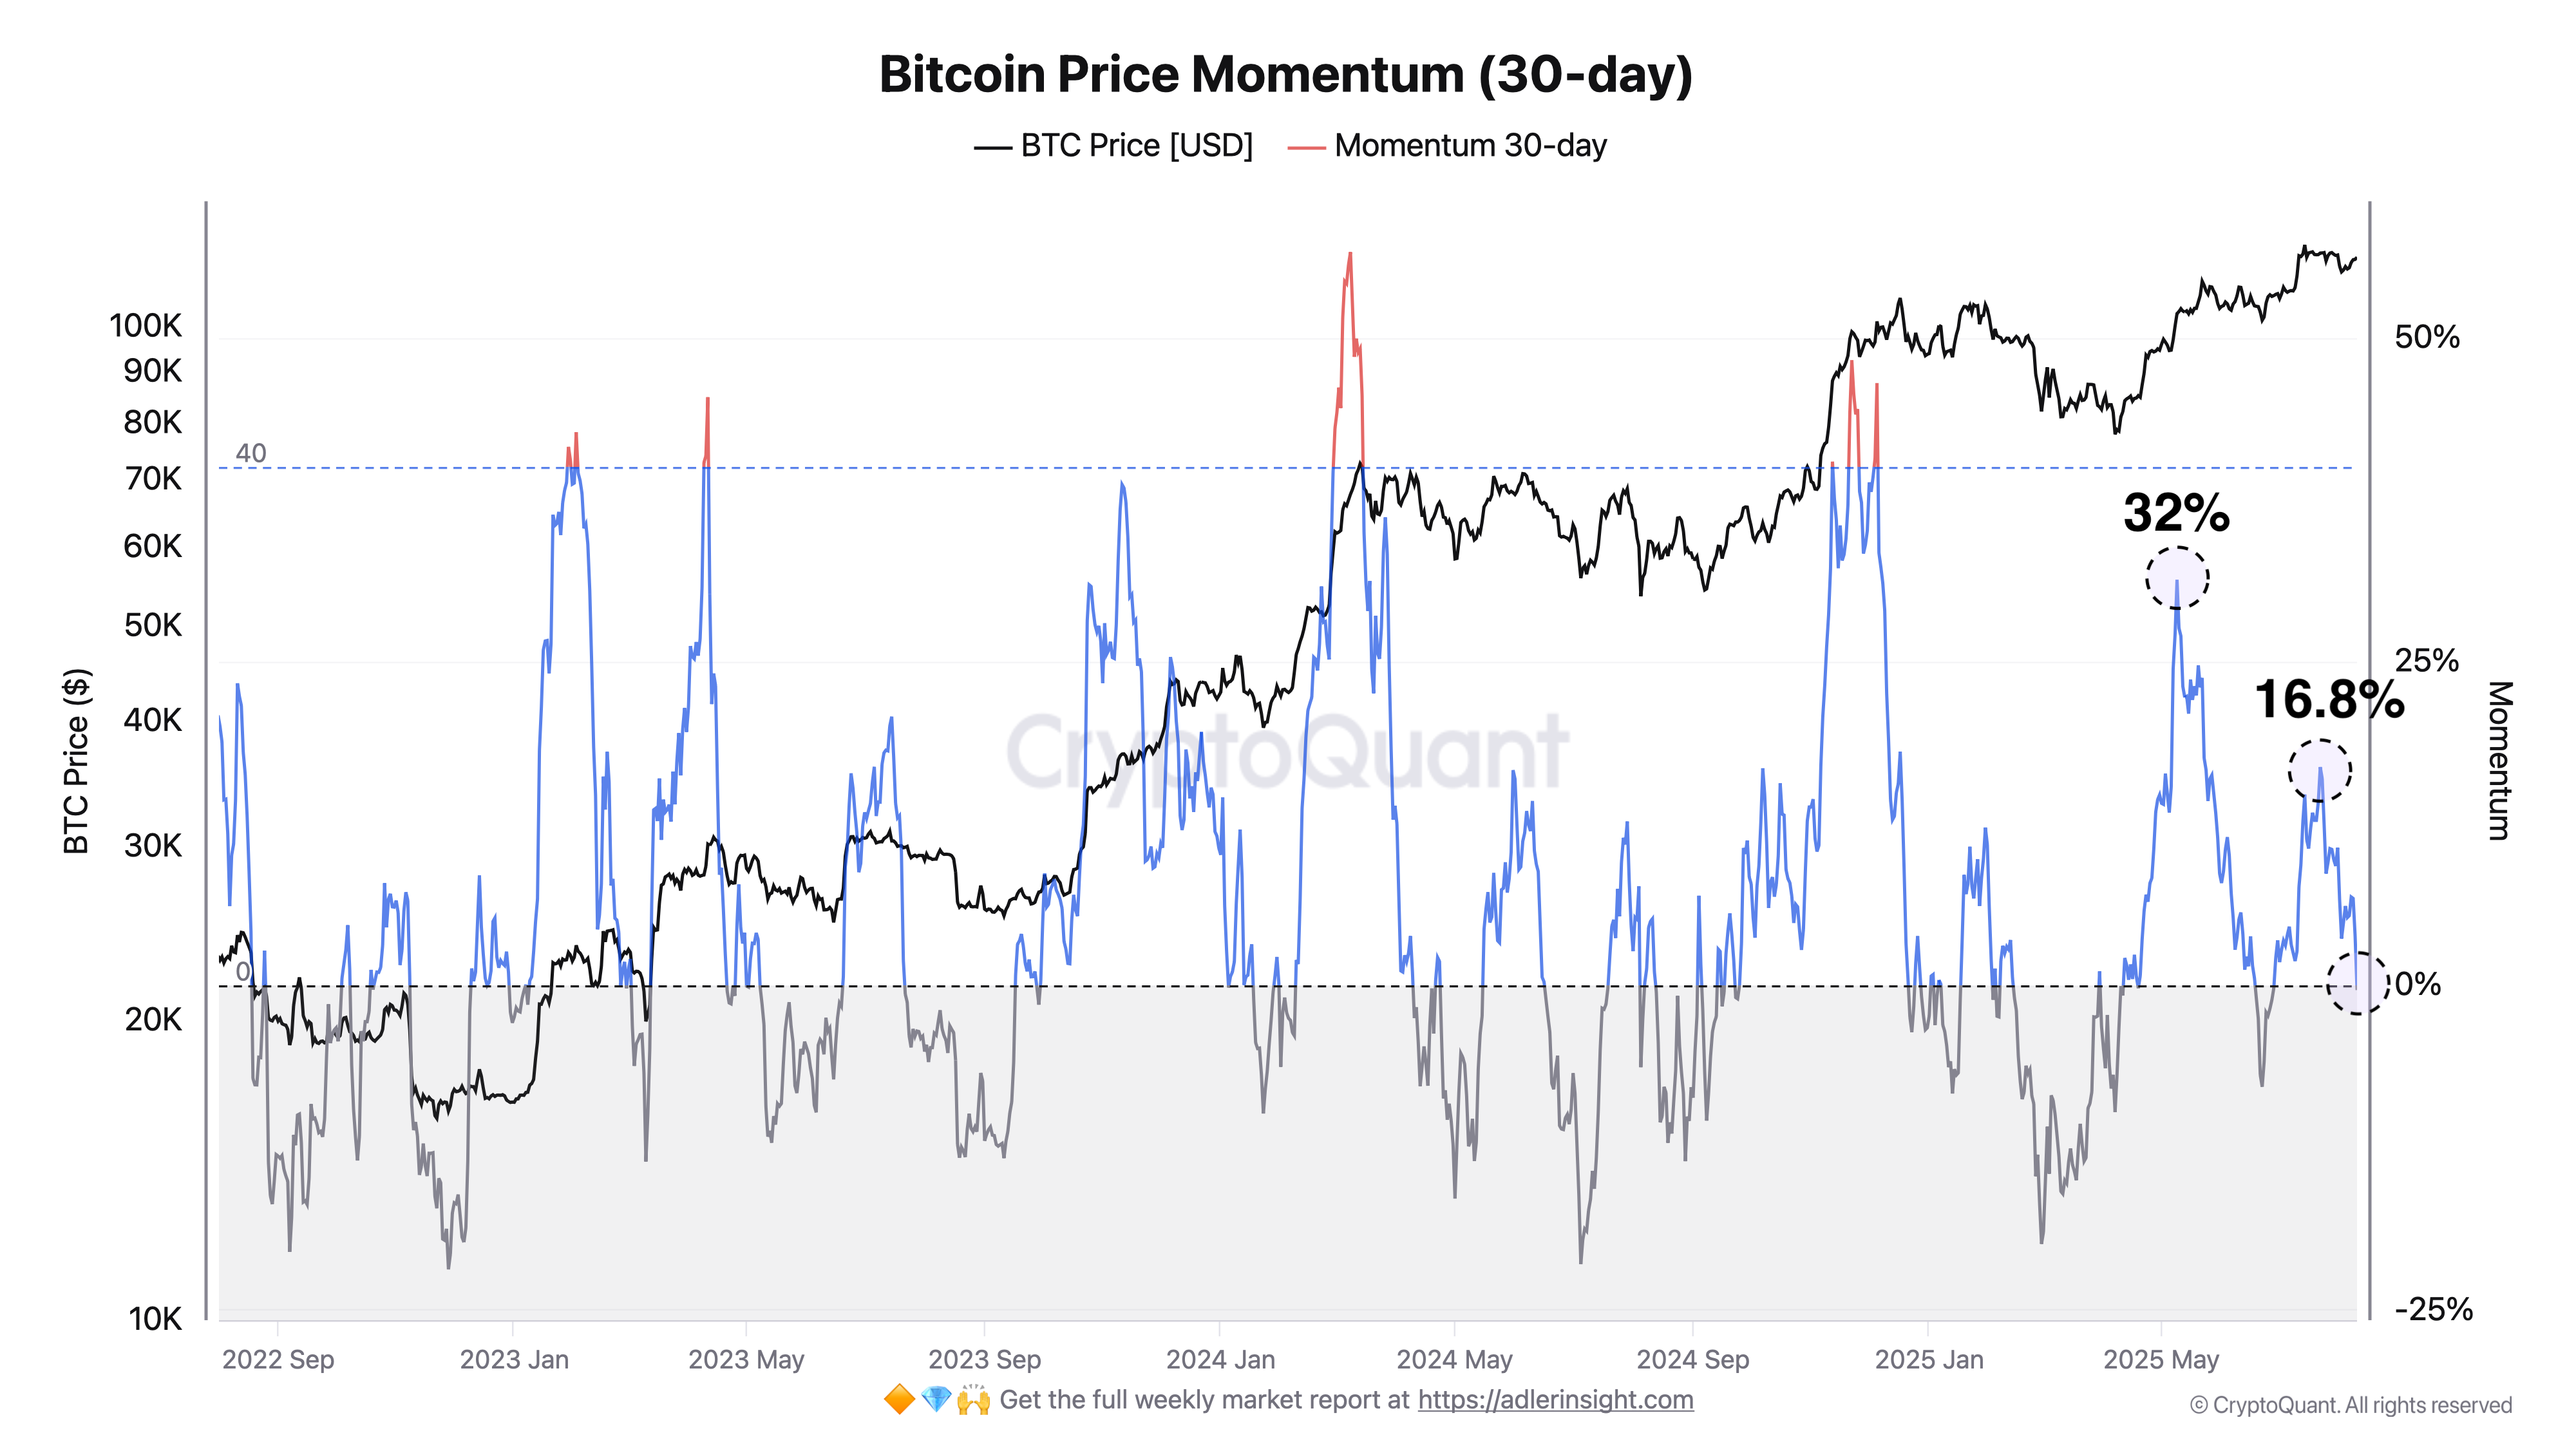
This week 30-day momentum declined from +3% to 0%, virtually reaching neutral zone. This confirms waning bullish acceleration and market transition to waiting/consolidation mode.
Conclusions
Momentum near zero (0%) reflects demand-supply balance, no clear side advantage.
Slide toward neutrality indicates short-term uptrend weakening, without new volume inflow sideways dynamics likely.
Signals: recovery above 8–10% strengthens bullish scenario, move to negative zone and close below −5% confirms growing bearish pressure.
3. Options Analysis
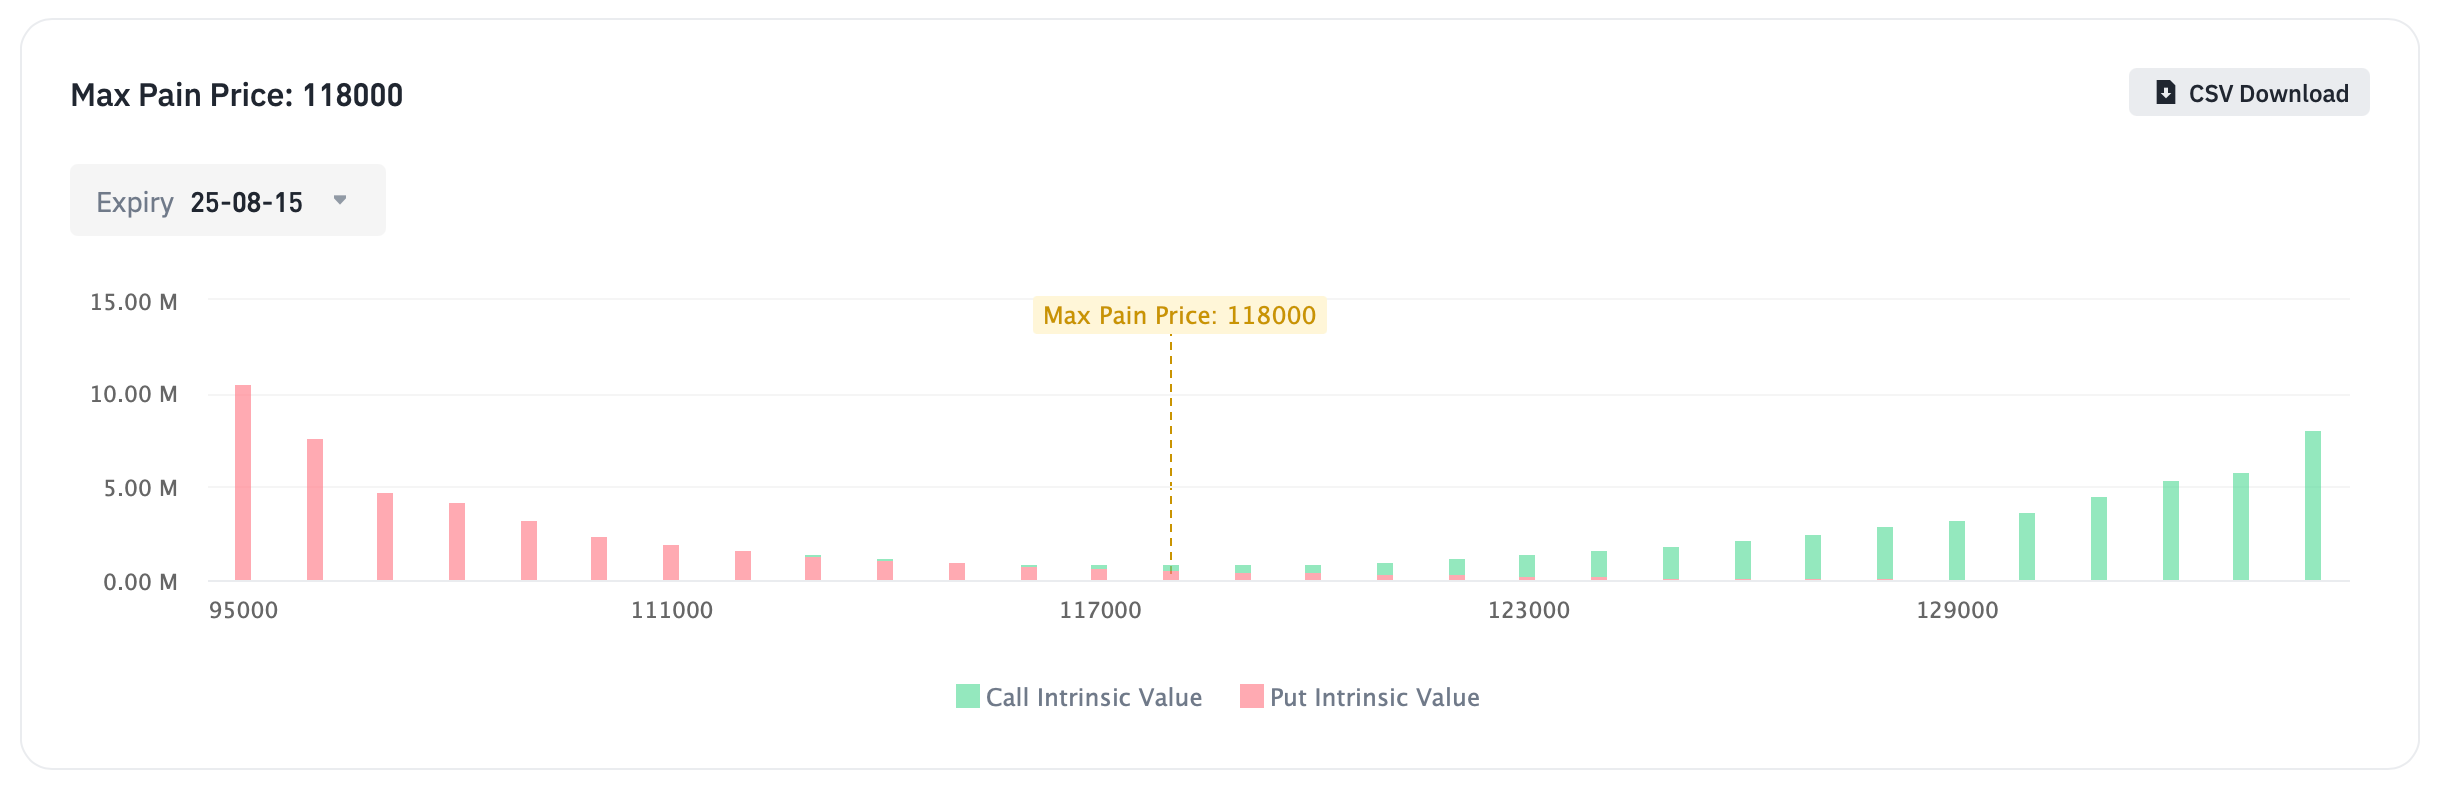
Max Pain Price: $118,000
Expiration date: August 15, 2025
Market structure
Call option dominance (green bars):
Main interest concentrated on high strikes above $118K:$133,000 (≈ 7.5–8.0M)
$132,000 (≈ 6.0M)
$131,000 (≈ 5.2M)
$130,000 (≈ 4.4–4.8M)
$129,000 (≈ 3.6–3.9M)
Right edge growth indicates continued upside hedging.
Put options (red bars):
Bearish bets concentrated in lower range:$95,000 (≈ 10–11M)
$97,000 (≈ 7–7.5M)
$99,000 (≈ 4.5–5.0M)
$101,000 (≈ 3.3–3.8M)
$103,000 (≈ 2.5–3.0M)
Above ~$110K red bars become insignificant (<~1M).
Comparative analysis with previous week
Max Pain change:
Max Pain unchanged and remains at $118,000.Volume dynamics:
Call: peak now shifted closer - to $131–133K (up to ≈ 7.5–8.0M), while super-high strikes (above $135K) activity lower than last week.
Put: emphasis strengthened at $95K (≈ 10–11M), while in $100–110K zone volumes slightly decreased/remained low (~0.5–3.5M).
Forecast
Bullish scenario:
$118K hold and further Call volume building supports $122–$125K test, with confident breakout - path to $130K+.Bearish scenario:
$118K breakout with Put volume growth (>~1M) in $112.5–$115K range may return price to $110–$112.5K.
Bitcoin network data analysis for this week
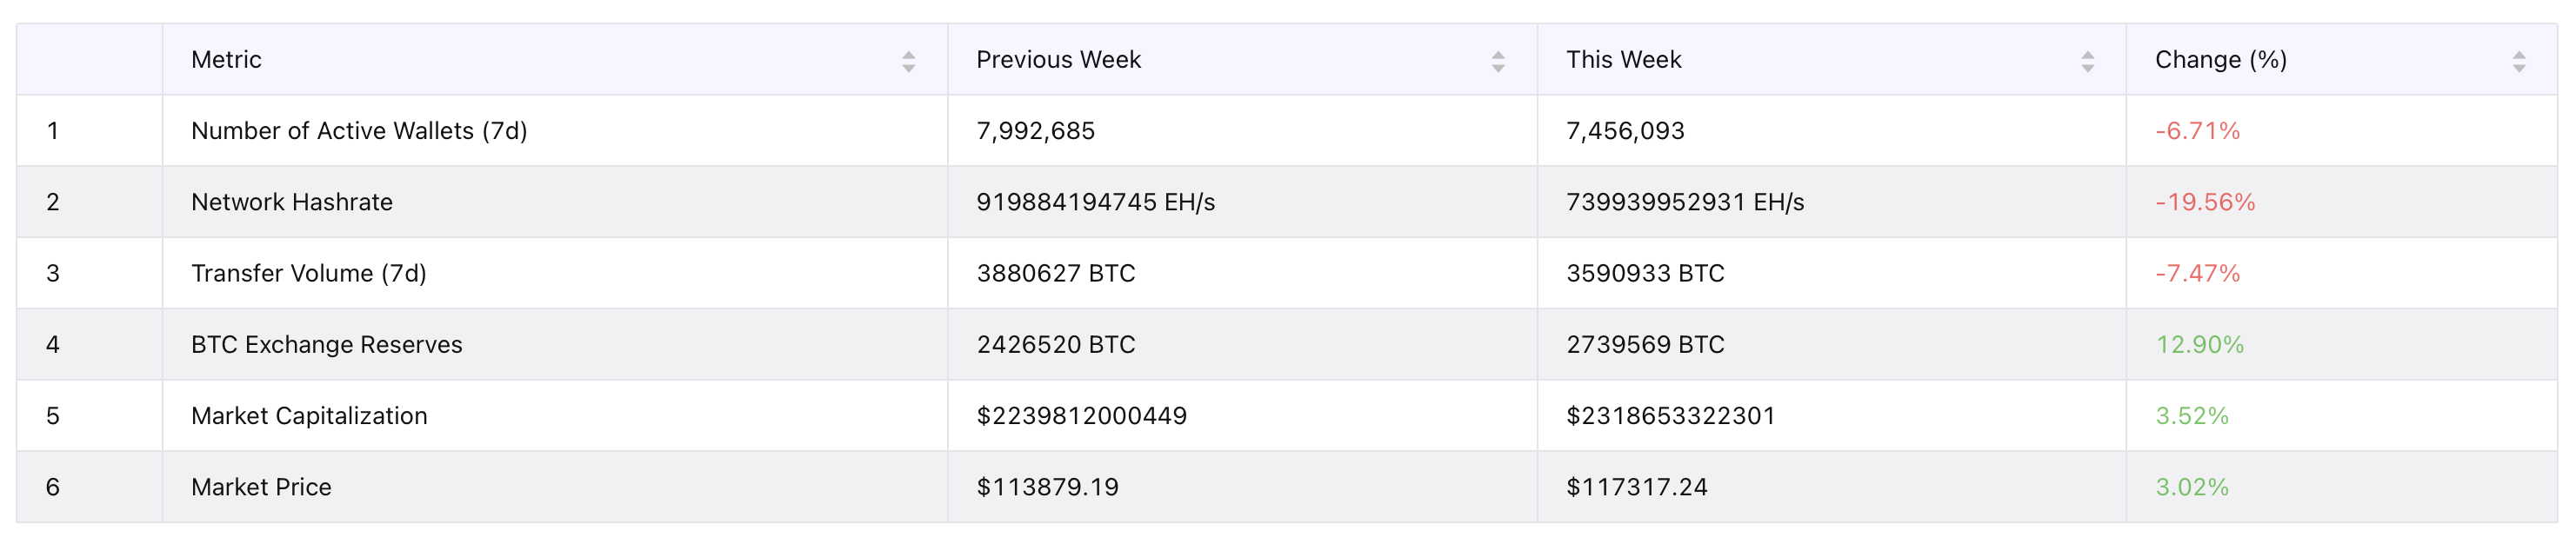
1. Number of Active Wallets (7d):
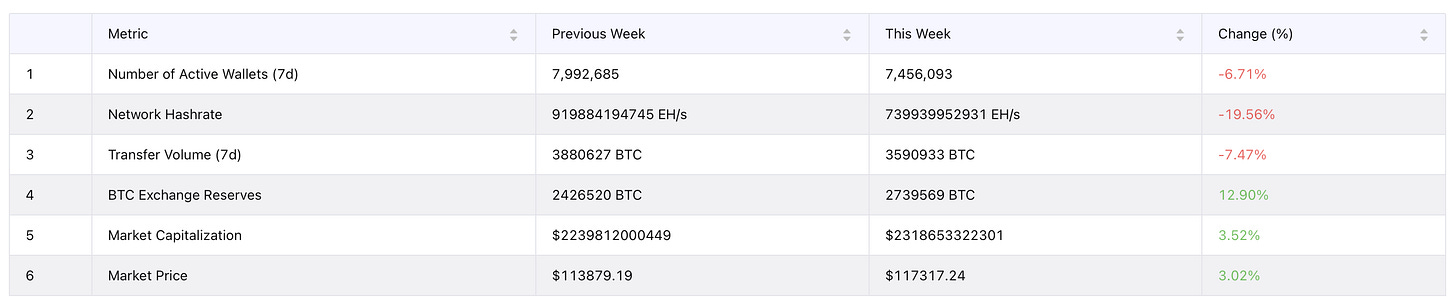
Previous Week: 7,992,685
This Week: 7,456,093
Change: 🔴 −6.71%
Comment: Address activity decline indicates consolidation and lower retail transaction share.
2. Network Hashrate:
Previous Week: 919,884,194,745 EH/s
This Week: 739,939,952,931 EH/s
Change: 🔴 −19.56%
Comment: Sharp hashrate decline may be related to temporary shutdowns/capacity redistribution. Network security remains high, but short-term block time deviations possible.
3. Transfer Volume (7d):
Previous Week: 3,880,627 BTC
This Week: 3,590,933 BTC
Change: 🔴 −7.47%
Comment: On-chain turnover decline reflects more cautious participant behavior and reduced speculative activity.
4. BTC Exchange Reserves:
Previous Week: 2,426,520 BTC
This Week: 2,739,569 BTC
Change: 🟢 +12.90%
Comment: Significant coin inflow to exchanges raises potential short-term supply - 🔔 important risk factor with weak on-chain activity!
5. Market Capitalization:
Previous Week: $2,239,812,000,449
This Week: $2,318,653,322,301
Change: 🟢 +3.52%
Comment: Capitalization growth amid activity decline indicates liquidity inflow outside network (spot/derivatives).
6. Market Price:
Previous Week: $113,879.19
This Week: $117,317.24
Change: 🟢 +3.02%
Comment: Price recovered despite hashrate and activity decline - possible derivatives and large player purchases contribution.
Conclusions
Metrics divergence: price and capitalization grow with activity decline and sharp hashrate drop, simultaneously exchange reserves increased +12.9% - this raises short-term supply risks.
Mining under pressure: −19.6% hashrate looks temporary, but worth monitoring recovery in coming weeks.
Market in "waiting" mode: declining active wallets and transfer volumes indicates retail caution, further price dynamics largely depends on whether exchange inflows remain high.

Price analysis
Bitcoin: Bollinger Bands Range
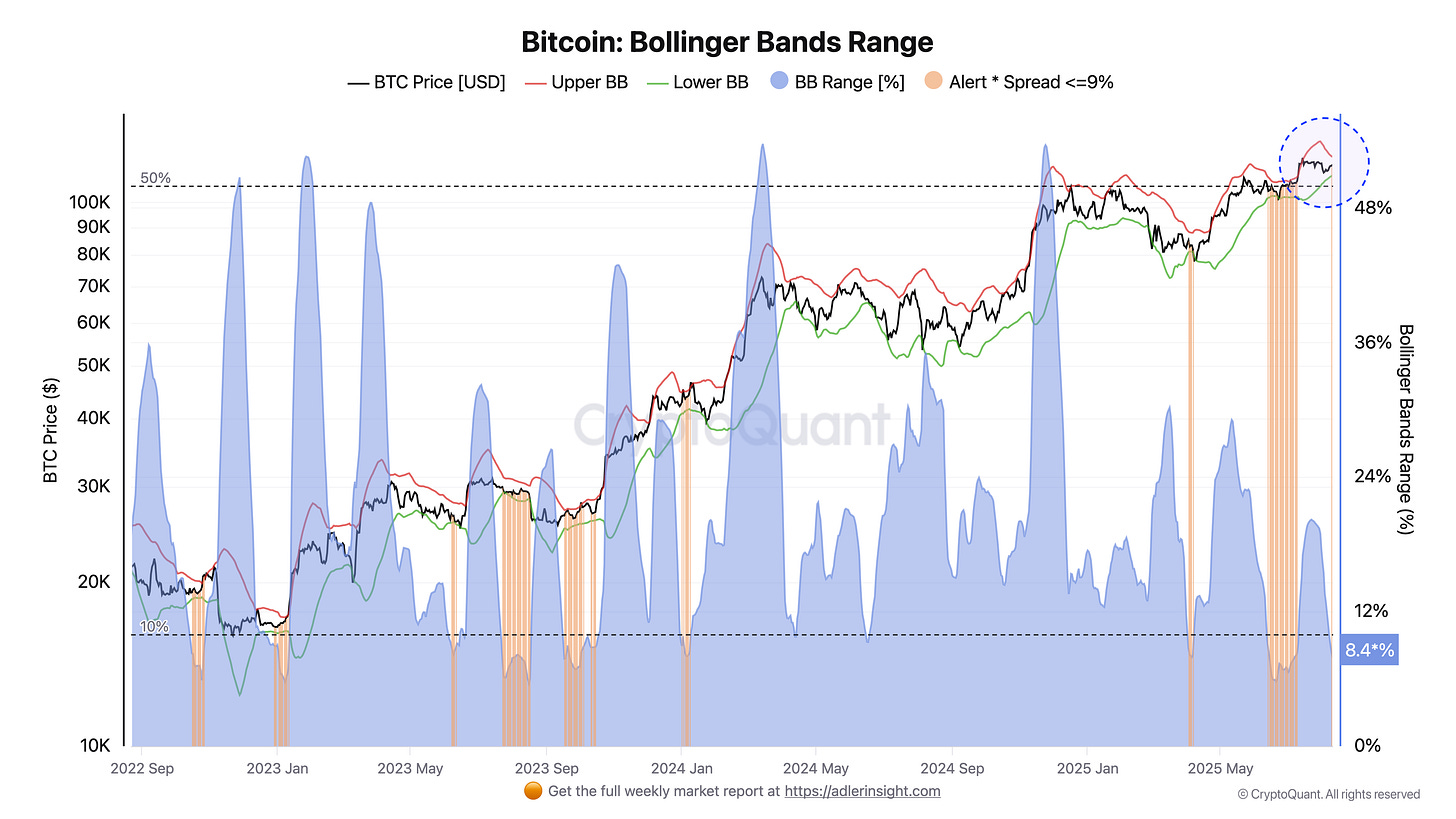
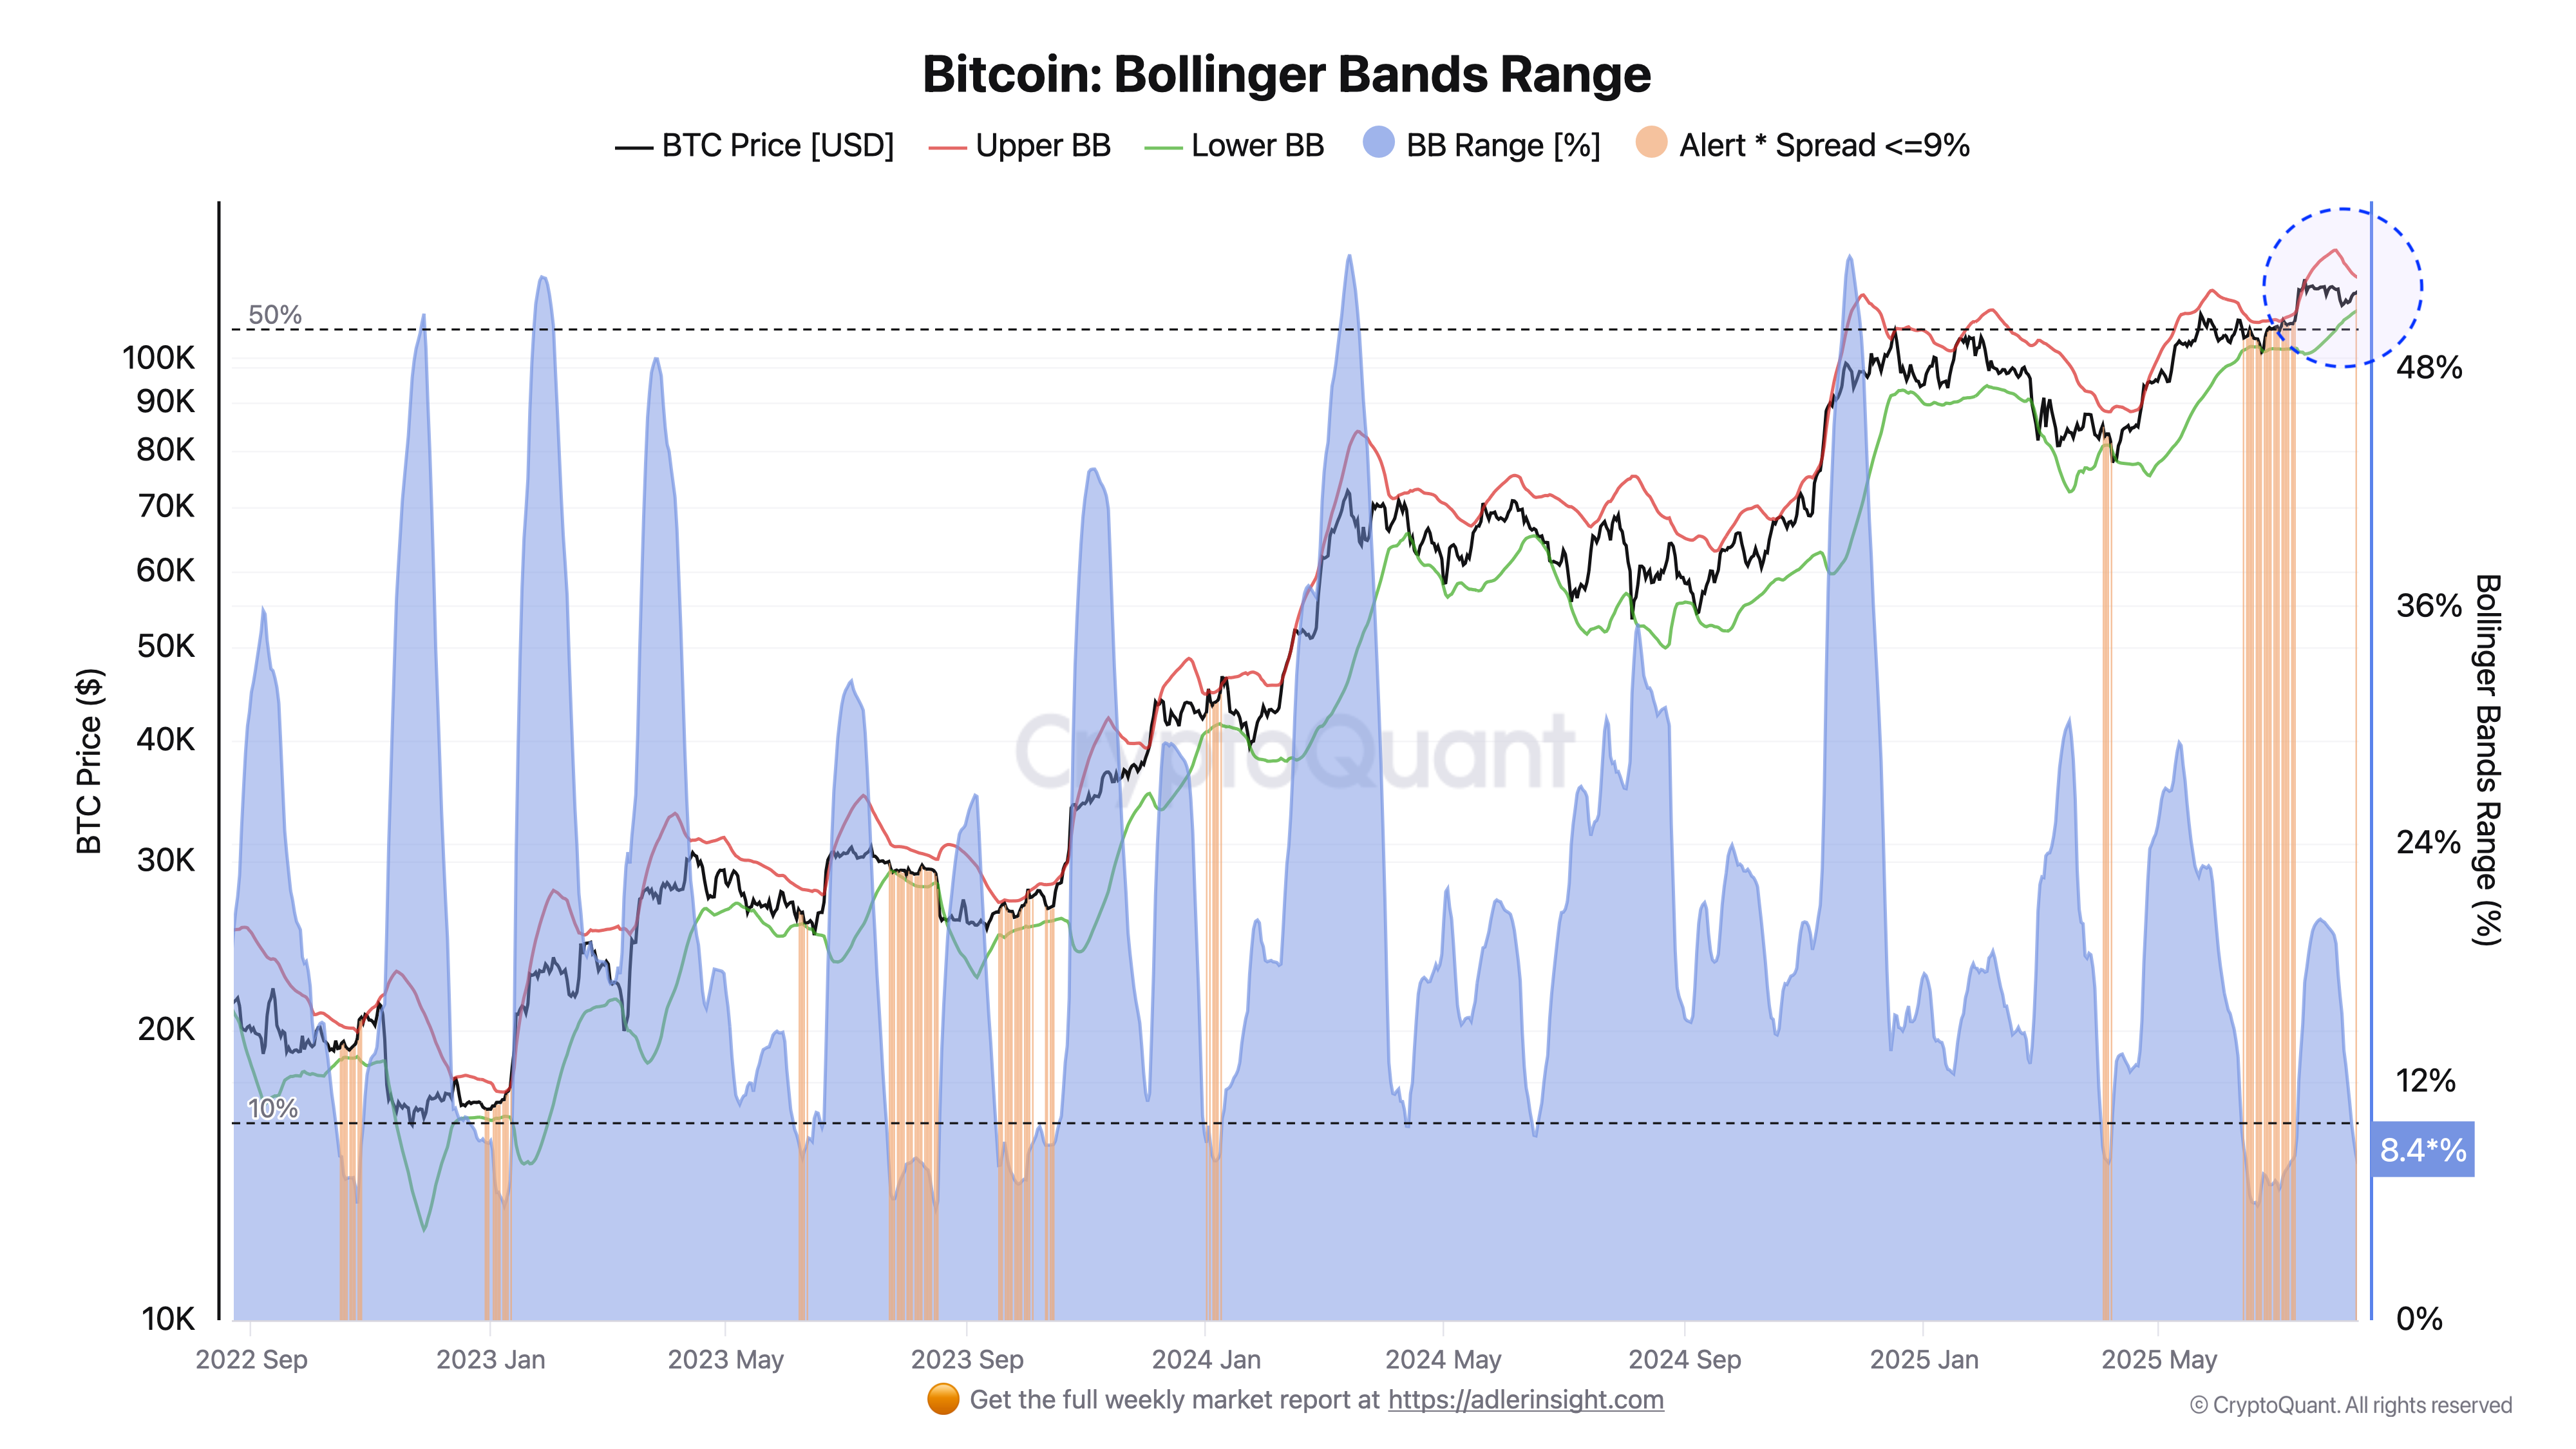
BTC Bollinger Bands range narrowed to 7.9–8.4% - falling below our 9% threshold, generating new Alert. Current levels: price ~$117K, upper band ~$121K, lower ~$112K, spot holds in upper corridor half, about 3.3% below upper boundary. Such compression usually reflects low realized volatility and energy accumulation for next impulse.
Conclusion: market entered range narrowing phase. Slope moderately bullish since price trades closer to upper band and near ATH, close above $121K will likely trigger volatility with primary amplitude around current BB width. Downward bounce and $112K breakout, conversely, confirm correction reversal. Narrow corridor raises sharp swing risks in both directions.


On-chain metrics
Bitcoin Dominance
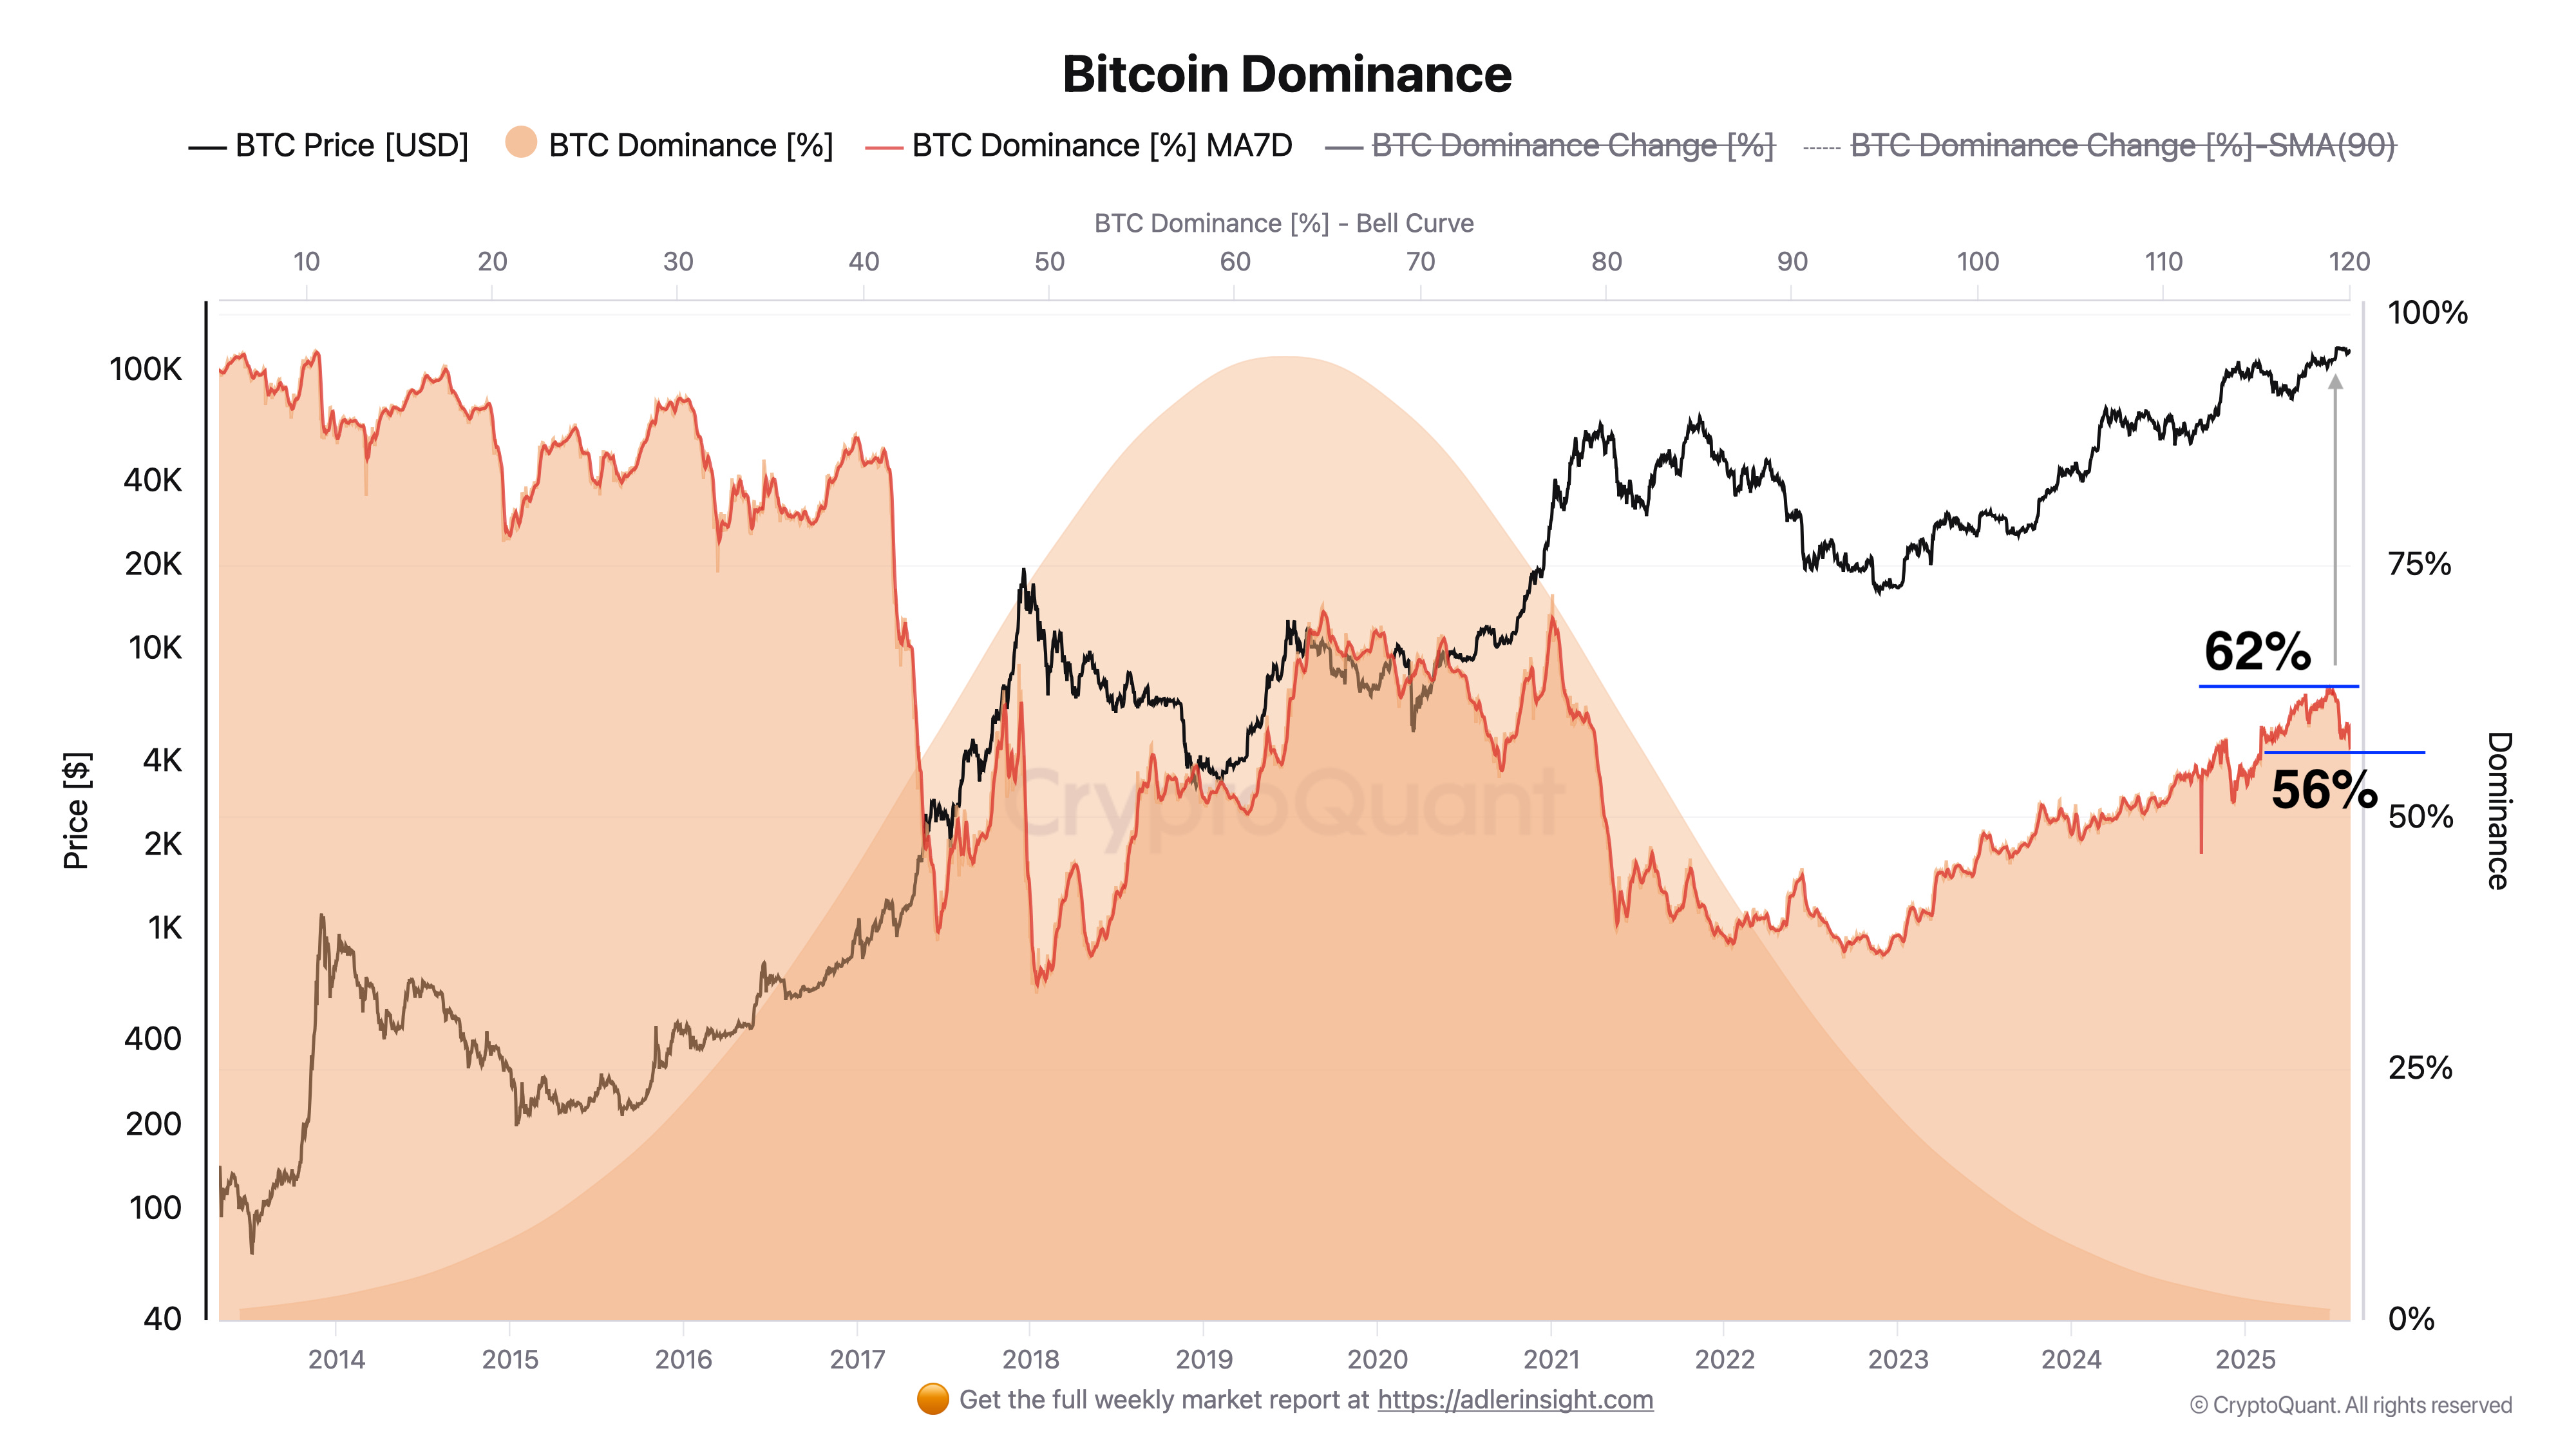
BTC dominance reversed from local peak 62% (mid-July) and declined amid liquidity rotation to ETH: rise to $4.3k, ~$5B ETF inflow and corporate purchases strengthened ether demand and temporarily weakened bitcoin. Chart shows key support in 56% zone: holding 58–62% range reads as pause in dominance uptrend.
Simultaneously BTC exchange reserves grew from 2,426,520 to 2,739,569 BTC weekly (+12.9%), notably raising short-term potential supply. With weak on-chain activity this amplifies risk of brief impulse selling when volatility expands, to relieve pressure need either flow reversal back to BTC or sufficient spot/ETF demand to absorb coin inflow.
Ethereum: Exchange Netflow (Total) - All Exchanges
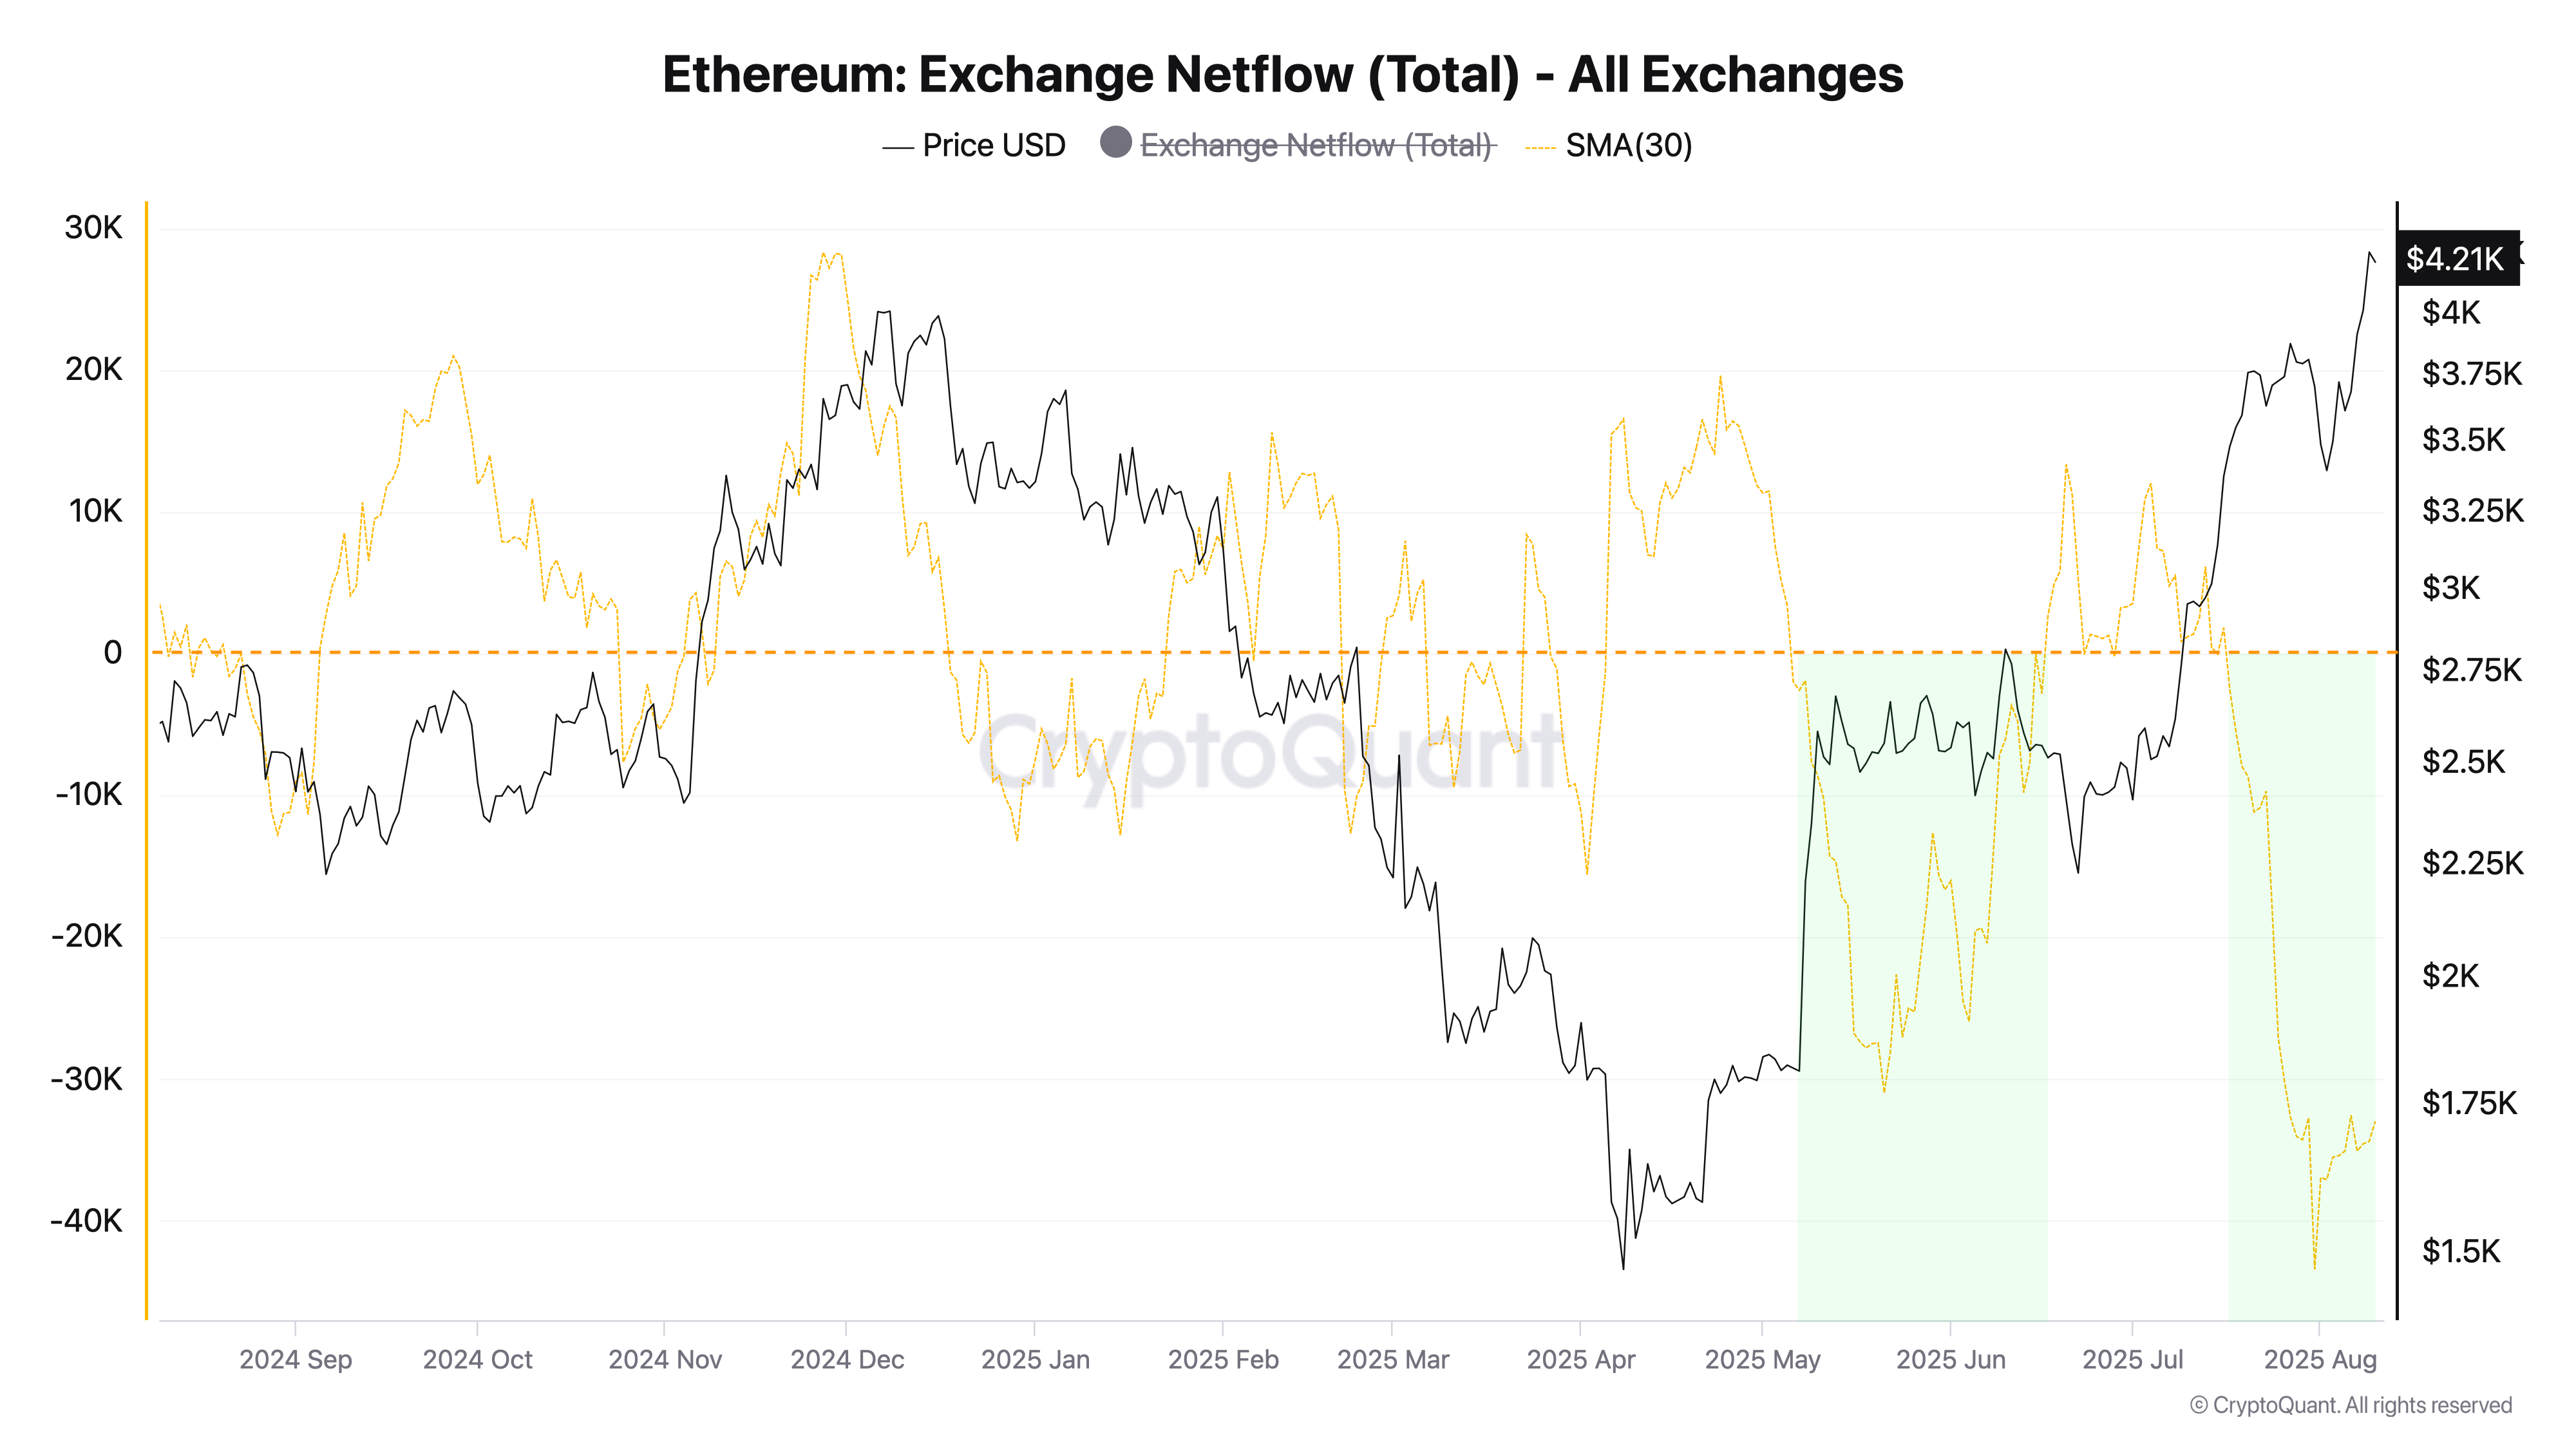
ETH exchange outflow sustainably negative (purchase dominance): 30-day SMA Netflow holds around −33k ETH/day at ~$4.2K price. Against BTC dominance decline in July this looks like continued liquidity rotation to ether: CEX supply shrinking, portion of coins going to staking/LST and under ETF demand, supporting ETH strengthening trend and additionally pressuring BTC market share.
Rally risk - flow reversal: after sharp ETH upsides appear positive Netflow spikes (coins brought to exchanges for profit-taking). If on compressed BTC volatility we see ETH Netflow reversal to positive and on-chain activity cooling, this becomes first signal for rotation pause and price pullback, maintaining negative inflows conversely keeps downward pressure on BTC dominance.
Bitcoin STH MVRV 155 days Range
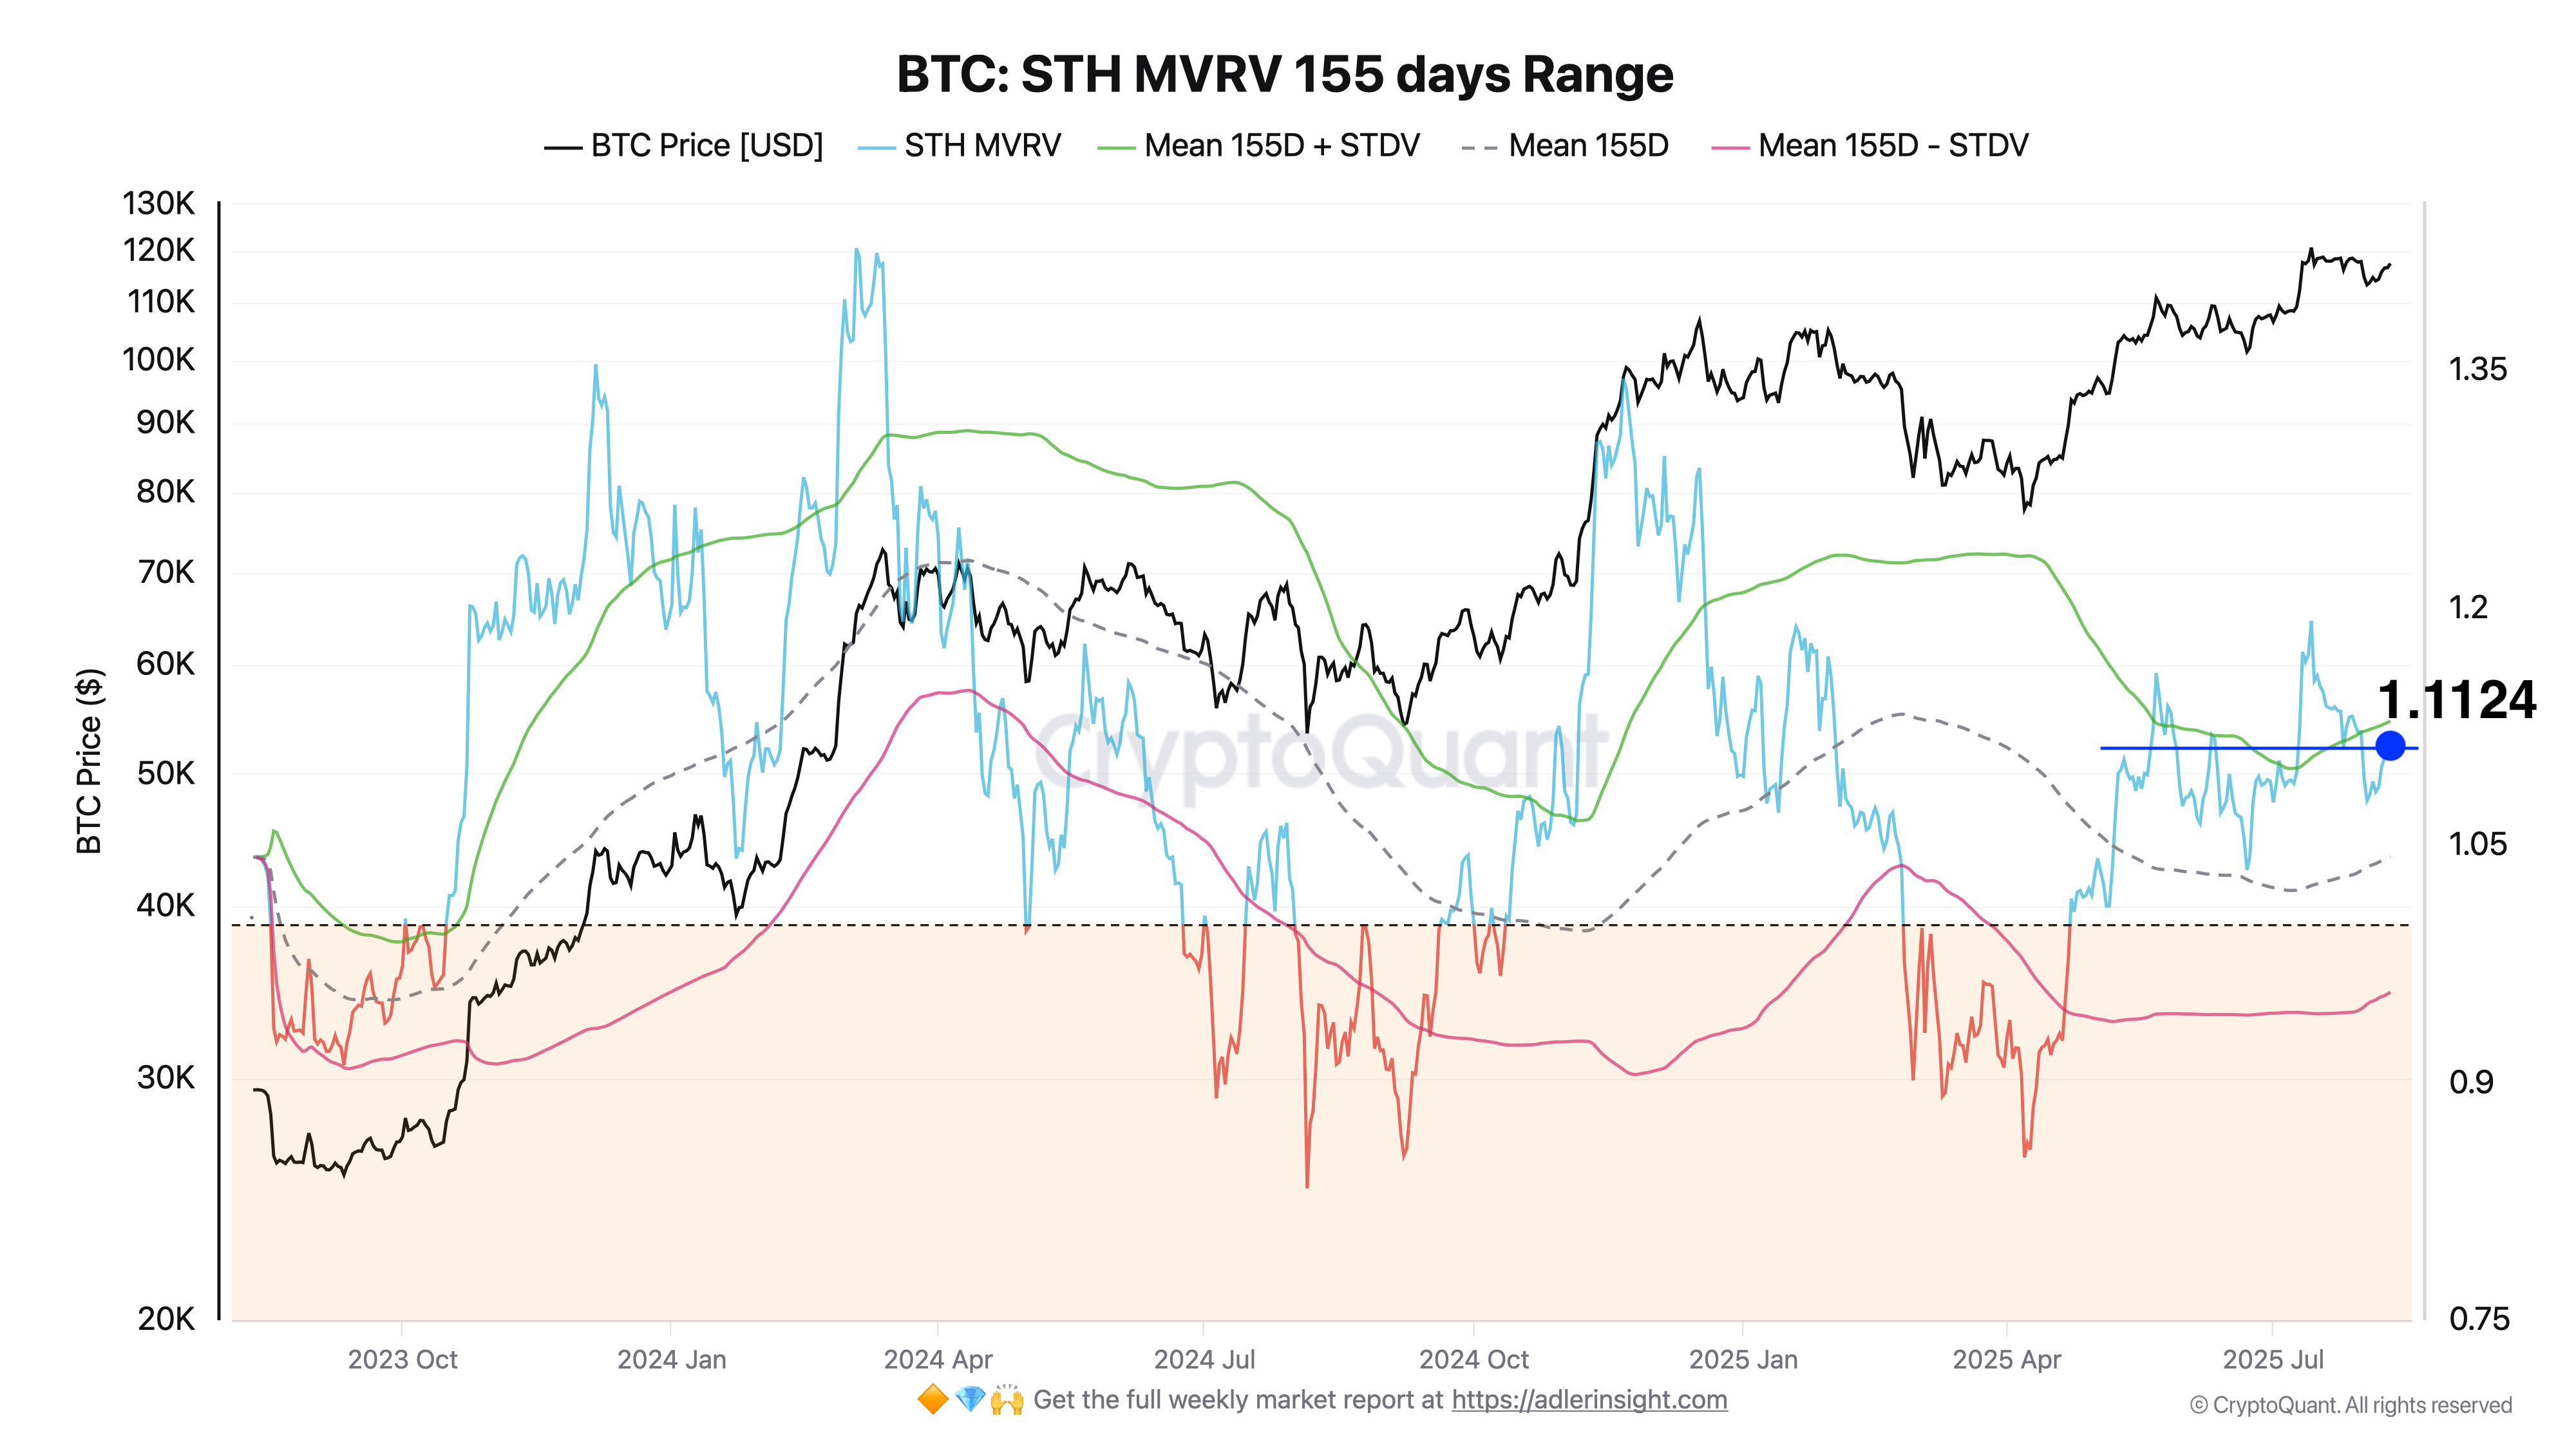
STH-MVRV holds at 1.112 - above average (≈1.043) and close to +1σ range upper boundary (≈1.128). This means typical short-term holder sits with ~11% unrealized profit: backdrop moderately bullish, but metric entering zone where historically local profit-taking probability and brief pullbacks rise, if spot/ETF demand doesn't strengthen.
Key trigger-reaction at upper boundary: confident STH-MVRV close above ~1.13 supports impulse, rejection and return to average (~1.04) signals transition to consolidation/correction. Crash risks limited for now: short-term depends on whether current "STH profit" grows into distribution or gets absorbed by incoming demand.

Conclusion
Week summary compression and pin at $118K. Soft macro backdrop (weak dollar, high Fed rate cut chances) and risk hedges through gold support risk demand, but tariff headlines keep volatility "on edge." For BTC price momentum = 0%, Bollinger Bands compressed to 8% range $116–$118.7K: structure reads as consolidation before next move. Max Pain $118K (Aug 15) raises "magnet" probability to expiration, $118.7K breakout → $121–$122K, hold above $121K opens $125K/$130K. $116K loss → $112.6K retest, below - key support $110K.
On-chain divergence favoring off-chain liquidity: active addresses and on-chain turnover declining, hashrate dropped (likely temporary), while BTC exchange reserves +12.9% - this is short-term supply overhang. Against ETH rotation backdrop BTC dominance pulled back from peaks, and STH-MVRV ≈1.11 close to zone where local profit-taking risk rises.
Base scenario - moderately bullish consolidation with elevated sharp breakout risks from narrow corridor.

Next week forecast
Market status: 🟣 HOLD (Neutral)
Material is for research purposes and does not constitute investment advice.
More details about the rating can be found at this link:
https://adlerinsight.com/Adler_Insight_Rating.pdf
Good luck in the upcoming trading week!
AAJ
Disclaimer:
This material has been prepared solely for informational purposes and does not constitute an offer, recommendation, or solicitation to buy or sell any securities, digital assets, or other financial instruments. The information presented in this report is considered reliable; however, its accuracy or completeness is not guaranteed. Past performance is not indicative of future results. Any investment decisions are made by the investor independently, taking into account personal financial circumstances and, if necessary, after consultation with a qualified professional. The author and affiliated parties may hold positions in the assets mentioned in this report. The author and publisher accept no responsibility for any direct or indirect losses arising from the use of this information.
Risks:
High volatility may lead to sharp fluctuations in value, adversely affecting investors' portfolios. Significant price swings may reduce the attractiveness of BTC to institutional investors, especially in the derivatives segment (futures, options). Potential tightening of regulatory requirements by governments and central banks may restrict access to BTC markets and reduce liquidity. Issues with custodial services, centralized exchanges, and hacking incidents could undermine confidence in the asset and negatively impact liquidity.