


Bitcoin Trends – W2 July 2025
Bitcoin storms toward $120K as institutional billions and exchange outflows set the stage for a new growth wave.

TL;DR:
Record BTC-ETF inflows, corporate purchases, and sustained coin outflows from exchanges strengthen bullish momentum: the options market sets $120–130K as next targets. While short-term holders are not yet overheated, rally potential remains intact.

Macroeconomics for the Past Week
Priority: High
UK GDP (May 2025): –0.1% m/m
Conclusion: The second consecutive monthly contraction, driven by declines in industrial (–0.9%) and construction sectors (–0.6%), raises doubts about growth sustainability in Q2 and heightens concerns about consumption and investment prospects in the UK.
Germany Wholesale Price Index (June 2025): +0.9% y/y
Conclusion: The strongest annual growth since March, mainly due to rising food and commodity prices, again raises inflationary risks in the eurozone and may delay further ECB policy easing.
Trump imposes 35% tariff on Canada effective August 1
Conclusion: Escalation of trade conflict with a key partner increases uncertainty, provokes delayed investments, and may weaken export-oriented sectors in both the US and Canada.
Canada unemployment rate (June 2025): 6.9%
Vывод: Unexpected decline from 7.0% with improved employment (+83,100) eases concerns about Canada's economy, but rising long-term unemployment share above last year's level indicates persistent structural challenges in the labor market.
Priority: Moderate
China CPI (June 2025): +0.1% y/y; core +0.7% y/y
Conclusion: First annual increase in five months reflects the impact of stimulus measures in the e-commerce sector, but deflationary trajectory in food and transport pressure still indicates restrained consumer demand.
US 30-year mortgage rate (July 4): 6.77% (+2 bp)
Conclusion: Rise after six-week low demonstrates market reaction to strong employment data and continuing monetary policy uncertainty, which may constrain housing affordability.
US 10-year Treasury yield (beginning of week): 4.35%
Conclusion: Pause in recent yield decline indicates balance between Fed easing expectations and escalating trade risks, slowing long-term rate growth.
Fed minutes testimony (June): divergent views
Conclusion: Policymakers were divided on rate cut timing: some ready to act as early as fall, others insist on waiting, maintaining uncertainty about future monetary strategy. Currently, consensus agrees that the probability of a July rate cut remains low at 5–7%.
Conclusion and Impact on Risk Assets
Intensifying trade risks (new US-Canada tariffs), slowdown in key UK and German economies, and divergent Fed signals create a backdrop of heightened caution for stocks and corporate bonds. Meanwhile, employment recovery in Canada and first signs of inflation in China add ambiguity: some capital will continue seeking yield in risk assets (technology, emerging markets), while geopolitical and trade risks will support demand for "safe havens" gold and government bonds.

Stock Market for the Past Week
Priority: High
Friday results:
S&P 500 −0.3%
Nasdaq 100 −0.1% (profit-taking on previous session gains to record)
Dow Jones −0.3% Conclusion: Friday's decline followed President Trump's announcement of a 35% tariff on Canadian imports and threats to extend high duties to other regions. This interrupted the indices' growth streak based on investor optimism.
Sectors and movement leaders:
Biggest decline: healthcare, financial sector
Growth: energy, consumer goods
Top among "Big Eight":
In the red:
Apple −0.6%
Meta −1.3%
Broadcom −0.4%
In the green:
Microsoft +0.4%
Tesla +0.1%
Nvidia +1.0%
Alphabet +1.4%
Amazon +1.2% Conclusion: Despite the overall negative backdrop, some tech giants and the energy sector managed to defend positions, reflecting diversified market reactions to tariff news.
Week results:
S&P 500 −1.1%
Dow Jones −1.1%
Nasdaq 100 +0.1% Conclusion: Moderate decline amid escalating trade risks contained further market growth. Nasdaq managed to maintain neutral dynamics thanks to volatility in large tech stocks.
Week Ahead
US trade policy: threat of 30% tariff on imports from Mexico and EU starting August 1 will intensify protectionism risks.
Earnings season: start of quarterly reports from major banks – key banking publications on Tuesday.
Macro data:
US: CPI, PPI, retail sales
China: GDP, trade balance
Japan, Canada, UK: inflation levels
Global events: G20 meeting in South Africa - possible statements on trade disputes and macroeconomic coordination.
Conclusion: Investors will continue monitoring the balance between corporate reports and geopolitical risks, with inflation data becoming the central driver of volatility. Against this backdrop, Bitcoin has completely decoupled from macro indicators, rising to $118K during the week – such signals suggest the crypto market is now moving independently of short-term trade news.

Important News from the Past Week
Priority: High
Bitcoin set a new all-time high: spot BTC-ETFs received $2.72 billion in inflows during the week, demonstrating strong institutional demand.
SharpLink bought 10,000 ETH from Ethereum Foundation for $25.7 million, bringing their ETH reserve to 215,634 coins ($558 million), establishing themselves among the largest public ether holders.
K Wave Media secured $1 billion in financing for Bitcoin treasury through deals with Anson Funds and Bitcoin Strategic Reserve, targeting accumulation of 10,000 BTC.
US Treasury Department repealed crypto broker reporting rules, transitioning to softer oversight and pro-cryptocurrency regulation.
US withdrew appeal in Tornado Cash case after lifting sanctions, definitively closing the legal dispute and demonstrating the administration's policy shift.
Shanghai regulators discuss stablecoin legalization, exploring the possibility of launching yuan-pegged coins despite the cryptocurrency ban in effect since 2021.
Priority: Moderate
Metaplanet acquired 2,205 BTC for $239 million, increasing reserves to 15,555 BTC and securing fifth place among public company holders.
KULR Technology bought additional $10 million in BTC, bringing their reserve to 1,021 BTC ($113 million) and recording $12 million in unrealized profit.
Priority: Low
Smarter Web Company bought 275 BTC for $29.75 million, bringing their accumulation to 1,275 BTC and claiming a spot among top-20 public BTC treasuries.
Conclusions
This week's new bitcoin records and large-scale institutional purchases set the overall market tone: record spot ETF inflows and major corporate purchases confirm large players' appetite. Simultaneously, the withdrawal of the Tornado Cash appeal underscores regulators' desire for more transparent and flexible oversight. Shanghai's plans to introduce yuan stablecoins demonstrate accelerating integration of digital assets into the global financial system.

Bitcoin Trading Week Macro Analysis
1. BTC/USD Pair Analysis
Key Weekly Indicators
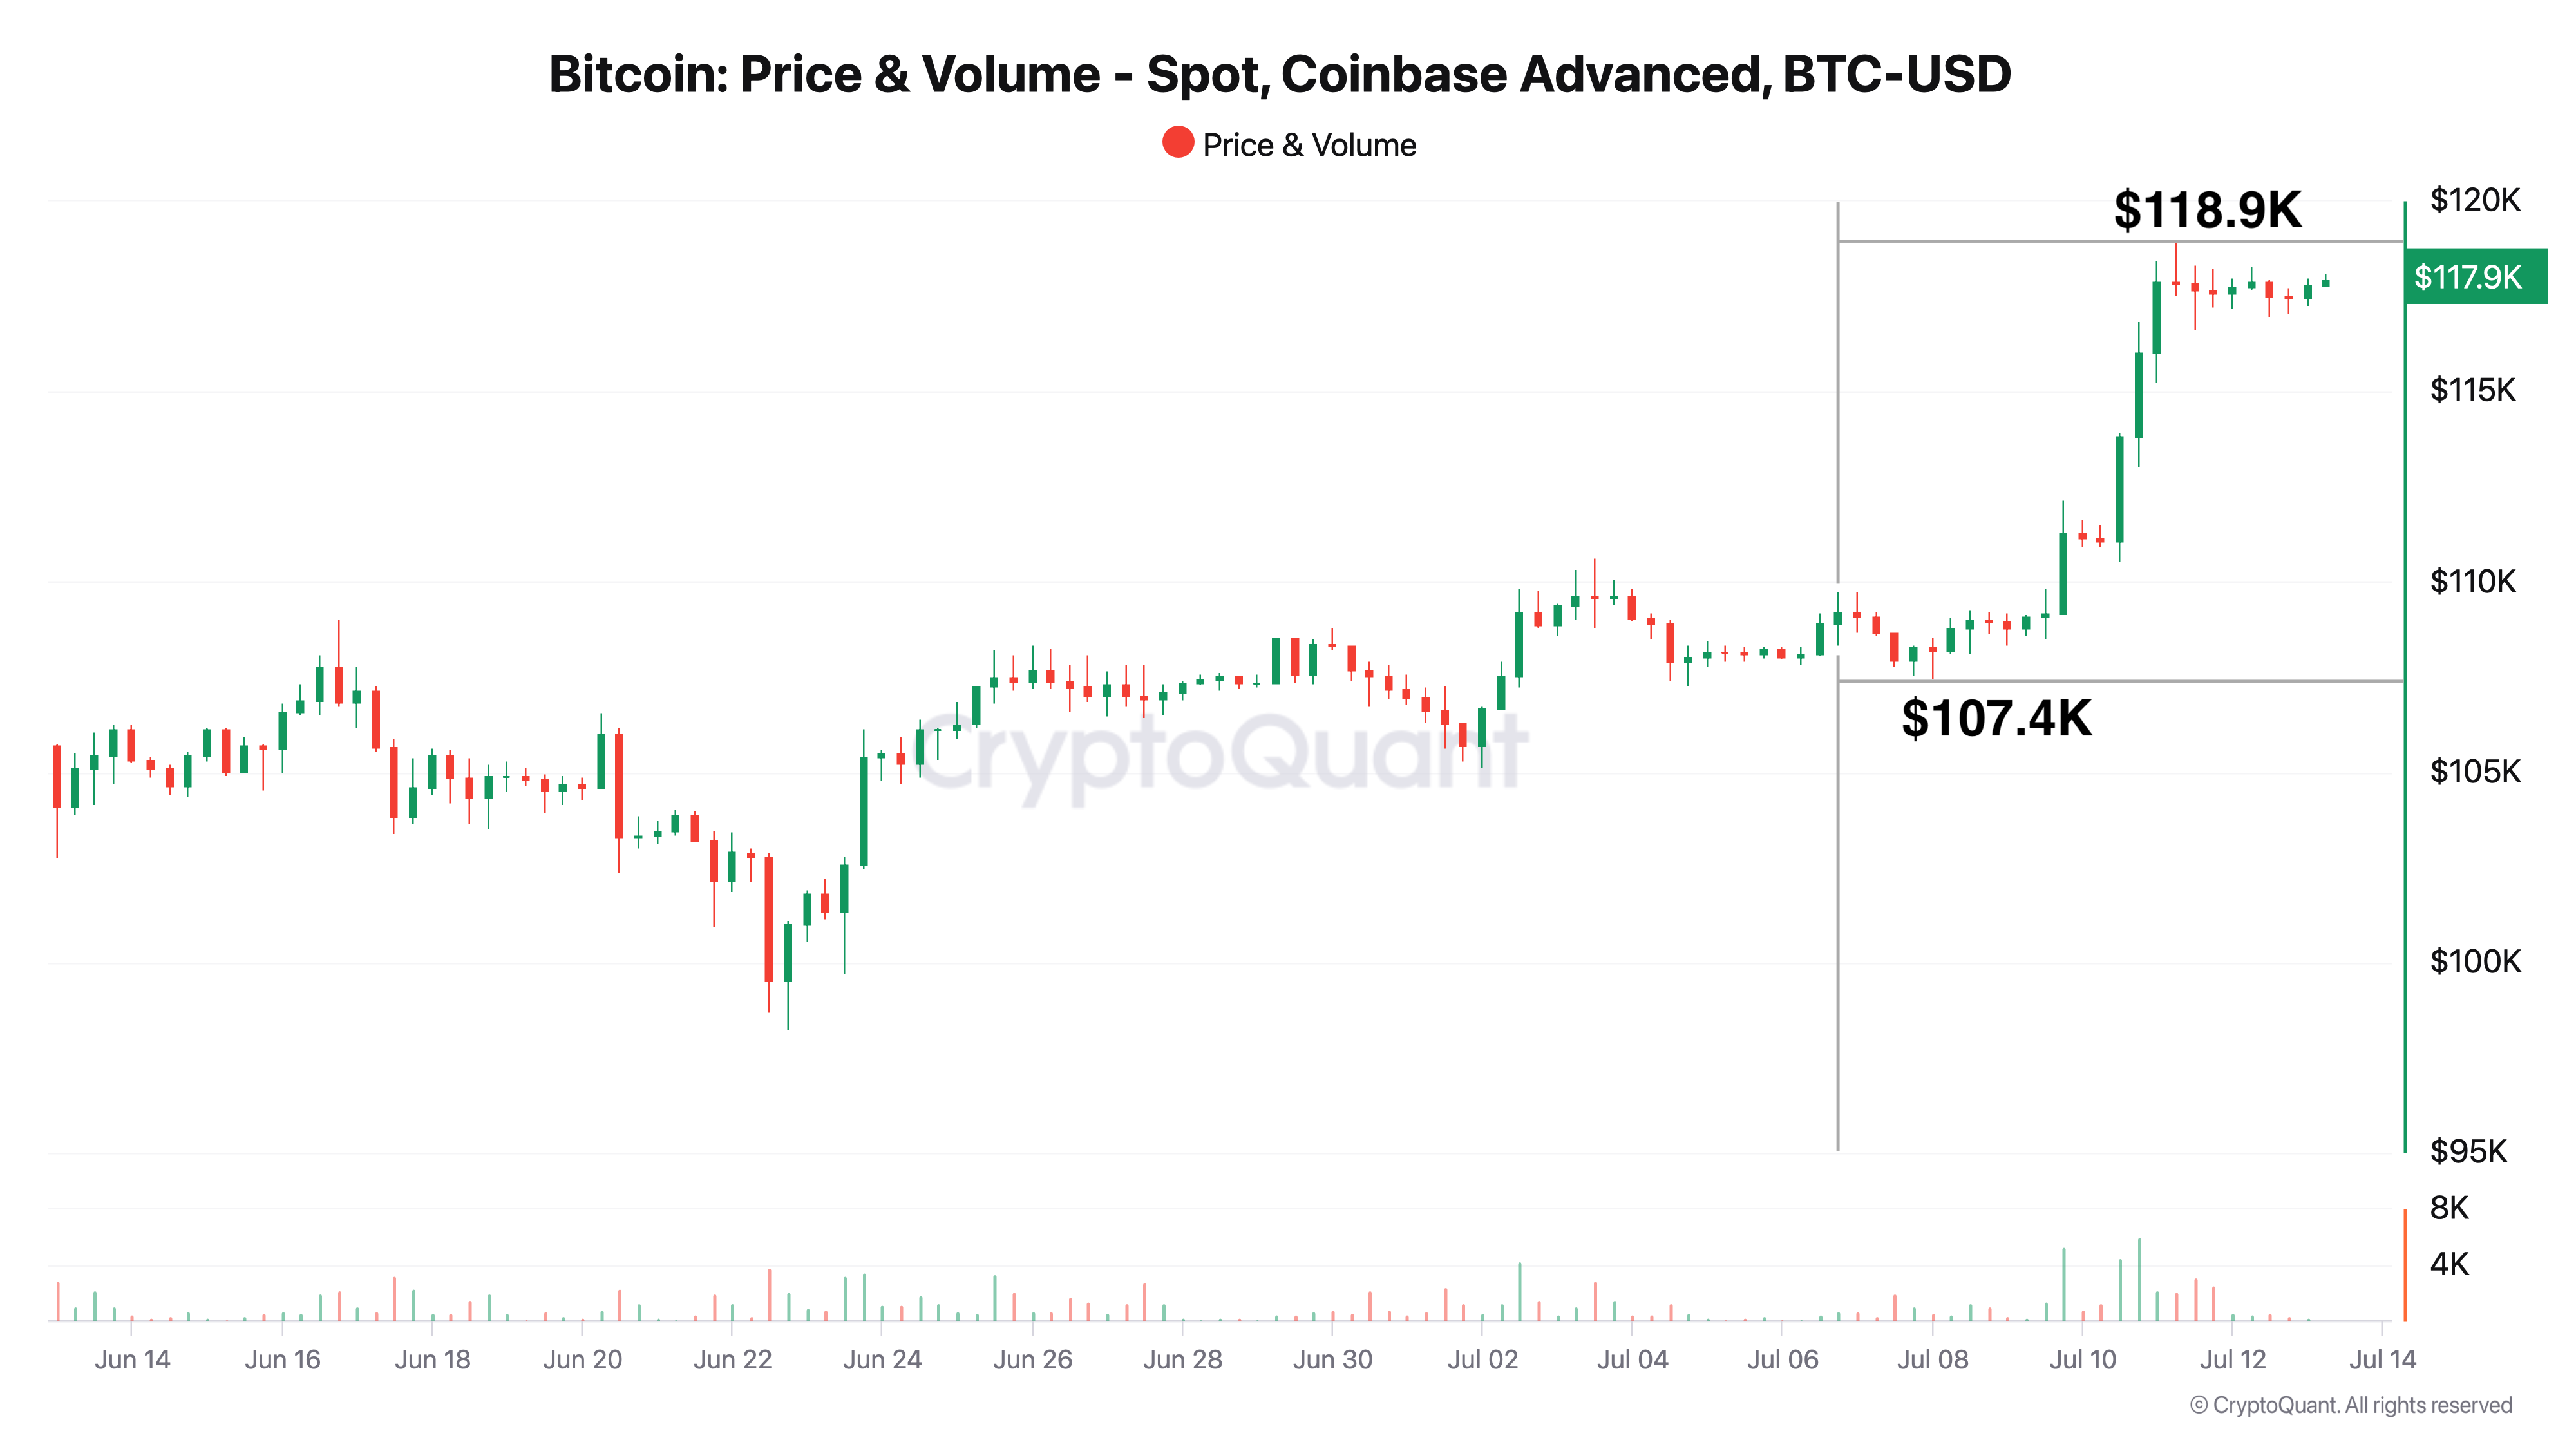
Current price: $117.9K
Local maximum: $118.9K
Local minimum: $107.4K
Trend
This week BTC continued its upward trend: after bouncing from $107.4K support, volumes increased during upward movement, allowing quick breakthrough of the $110K zone and reaching $118.9K. At period's end, narrow consolidation is observed at new highs ($117–$118.9K) with declining volumes – a sign of profit-taking and accumulation before the next impulse.
Conclusions
Key resistance: $118.9K – confident breakthrough with volume growth could lead to $120–$125K test.
Local support: $110K – holding this level will maintain bullish sentiment and minimize sharp correction risks.
Strong base support: $105K – critical level for long-term positions and strategy reassessment point during deeper pullbacks.
2. Bitcoin Price Momentum (30-day)
This Week's Analysis
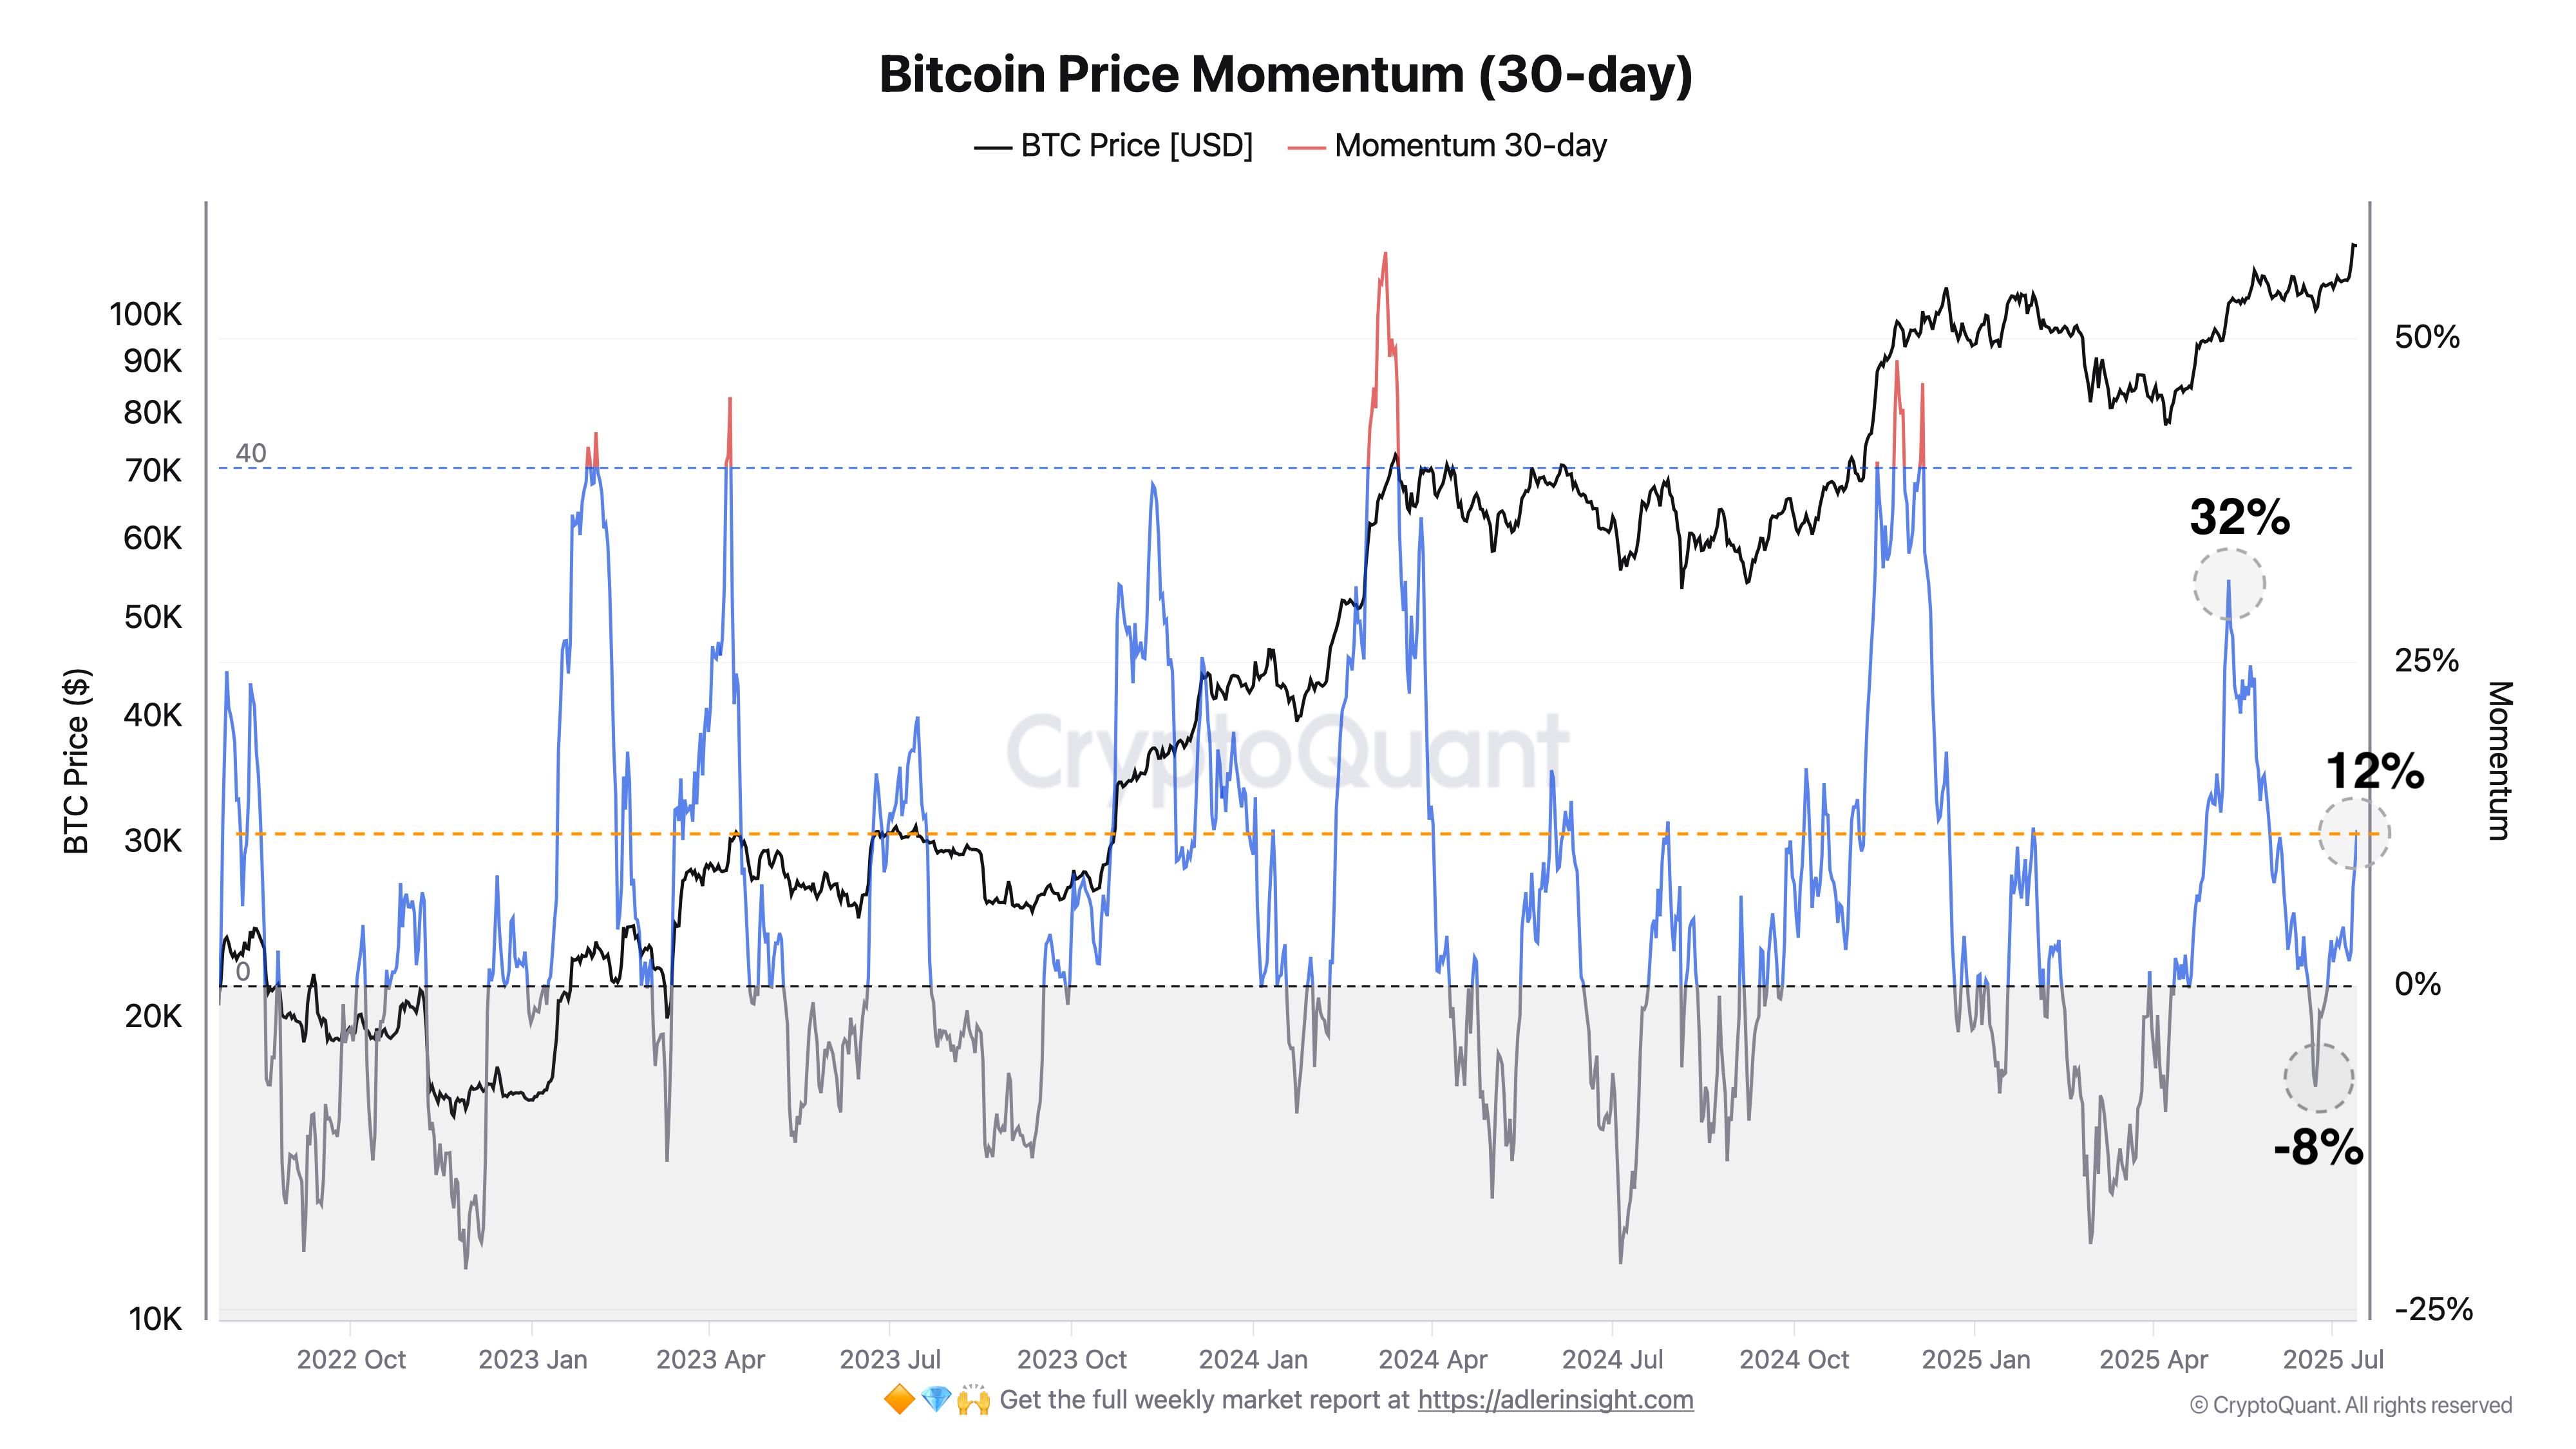
This week's 30-day momentum grew from +4.2% to +12%, meaning confident exit from neutral zone and establishment in positive territory.
Conclusions
Momentum above zero (+12%) confirms return of bullish activity: buyers again take initiative.
Momentum level still notably below (30%) indicates additional potential for rally continuation.
3. Options Analysis
Market Structure
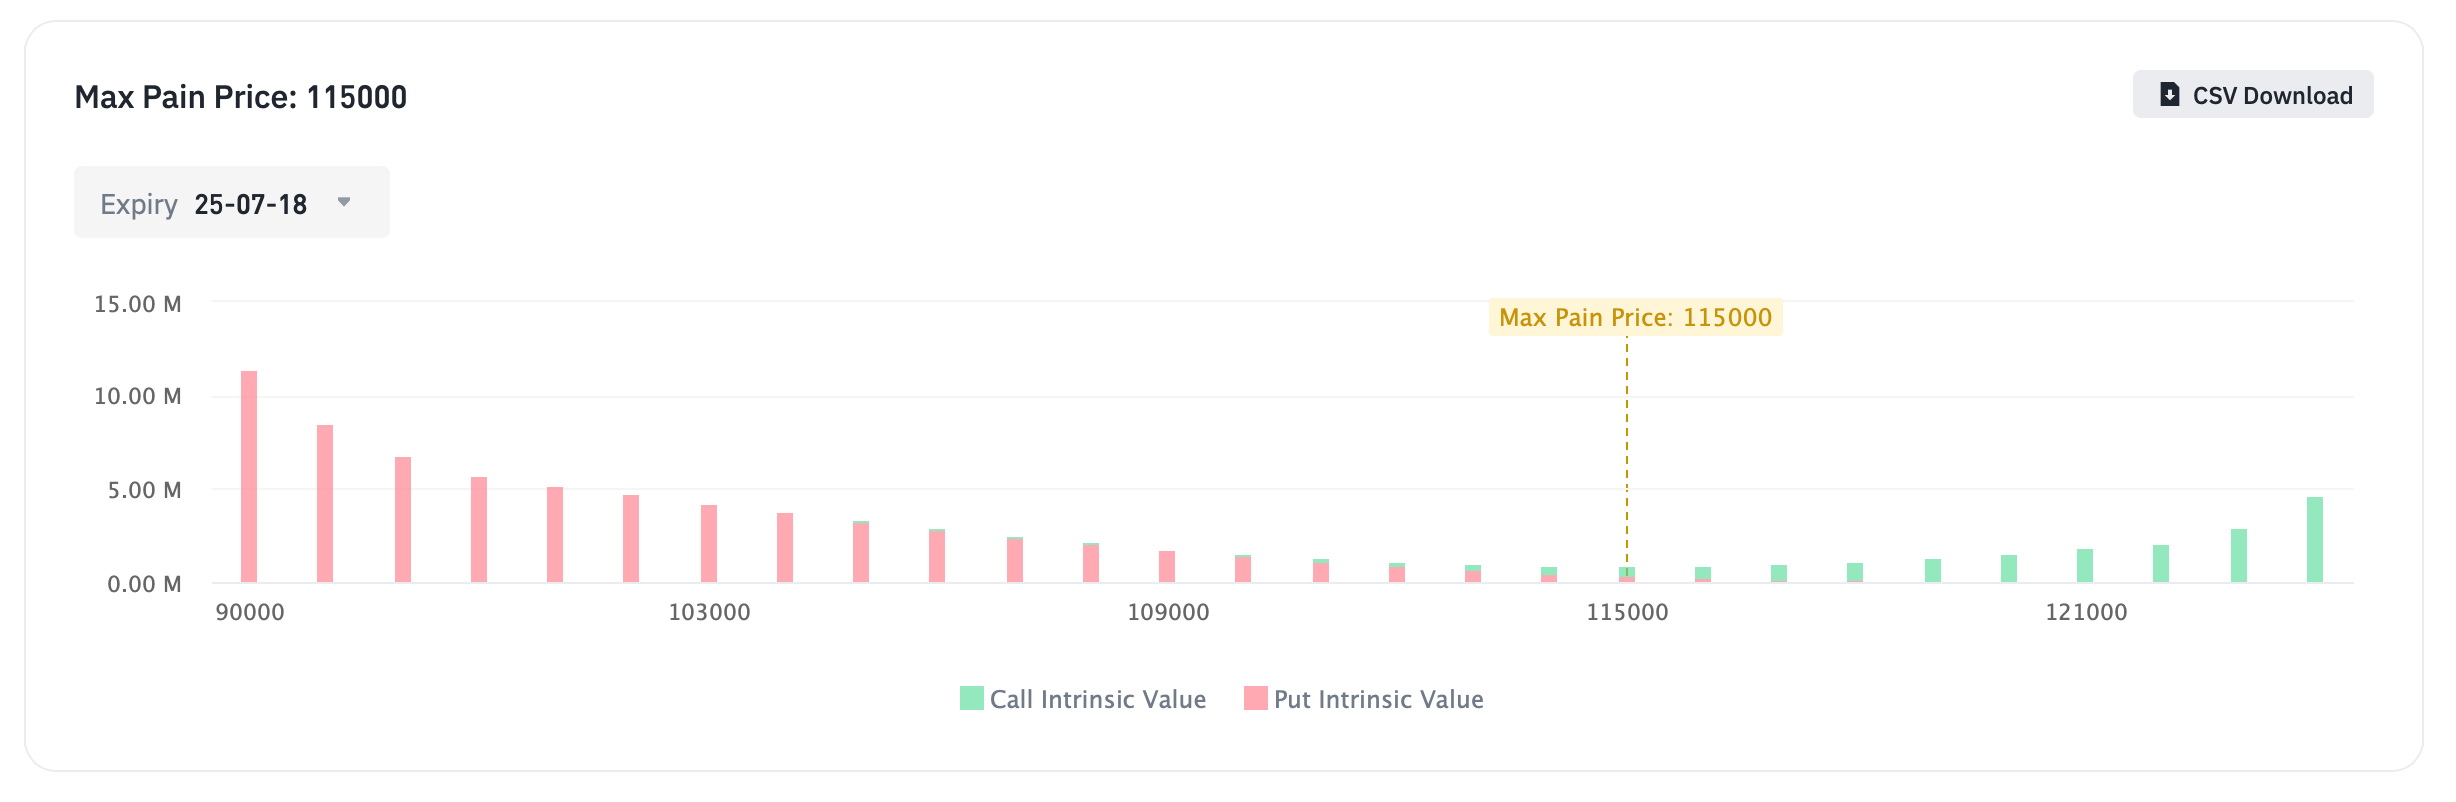
Call options dominance:
Green bars concentrated on $120,000–$130,000 strikes, with peak volumes:$130,000 (≈ 9M)
$127,500 (≈ 8M)
$125,000 (≈ 6M)
$122,500 (≈ 5M)
$120,000 (≈ 4M)
This indicates active hedging of growth above new Max Pain.
Put options:
Red bars dominate on $85,000–$95,000 strikes, with maximums:$85,000 (≈ 11M)
$87,500 (≈ 7.5M)
$90,000 (≈ 6M)
$92,500 (≈ 5M)
$95,000 (≈ 4.5M)
Above $95,000 Put volumes quickly decrease:
$97,500 (≈ 3M)
$100,000 (≈ 2.8M)
$102,500 (≈ 2.5M)
$105,000 (≈ 2M)
$107,500 (≈ 1M)
Comparative Analysis with Previous Week
Max Pain change:
Max Pain level rose from $108,000 to $115,000.Volume dynamics:
Call: peak strikes $125,000–$130,000 added 2–3M each, middle range $120,000–$122,500 grew by 2M.
Put: volumes on key strikes $85,000–$90,000 increased by 1–1.5M, in $92,500–$95,000 zone by 1M, while Put volumes above $95,000 remained at high levels but with small growth (+0.5–1M).
Forecast
Possible growth:
Holding support at $115,000 and further Call volume growth may lead to $120,000–$122,500 test, and with confident breakthrough to $130,000.Correction risks:
Breaking $115,000 level while simultaneously building Put volumes (> 1M) on $110,000–$112,500 strikes may return price to $108,000–$110,000, where main bearish defense is concentrated.

Bitcoin Network Data Analysis for This Week
1. Network Hashrate:
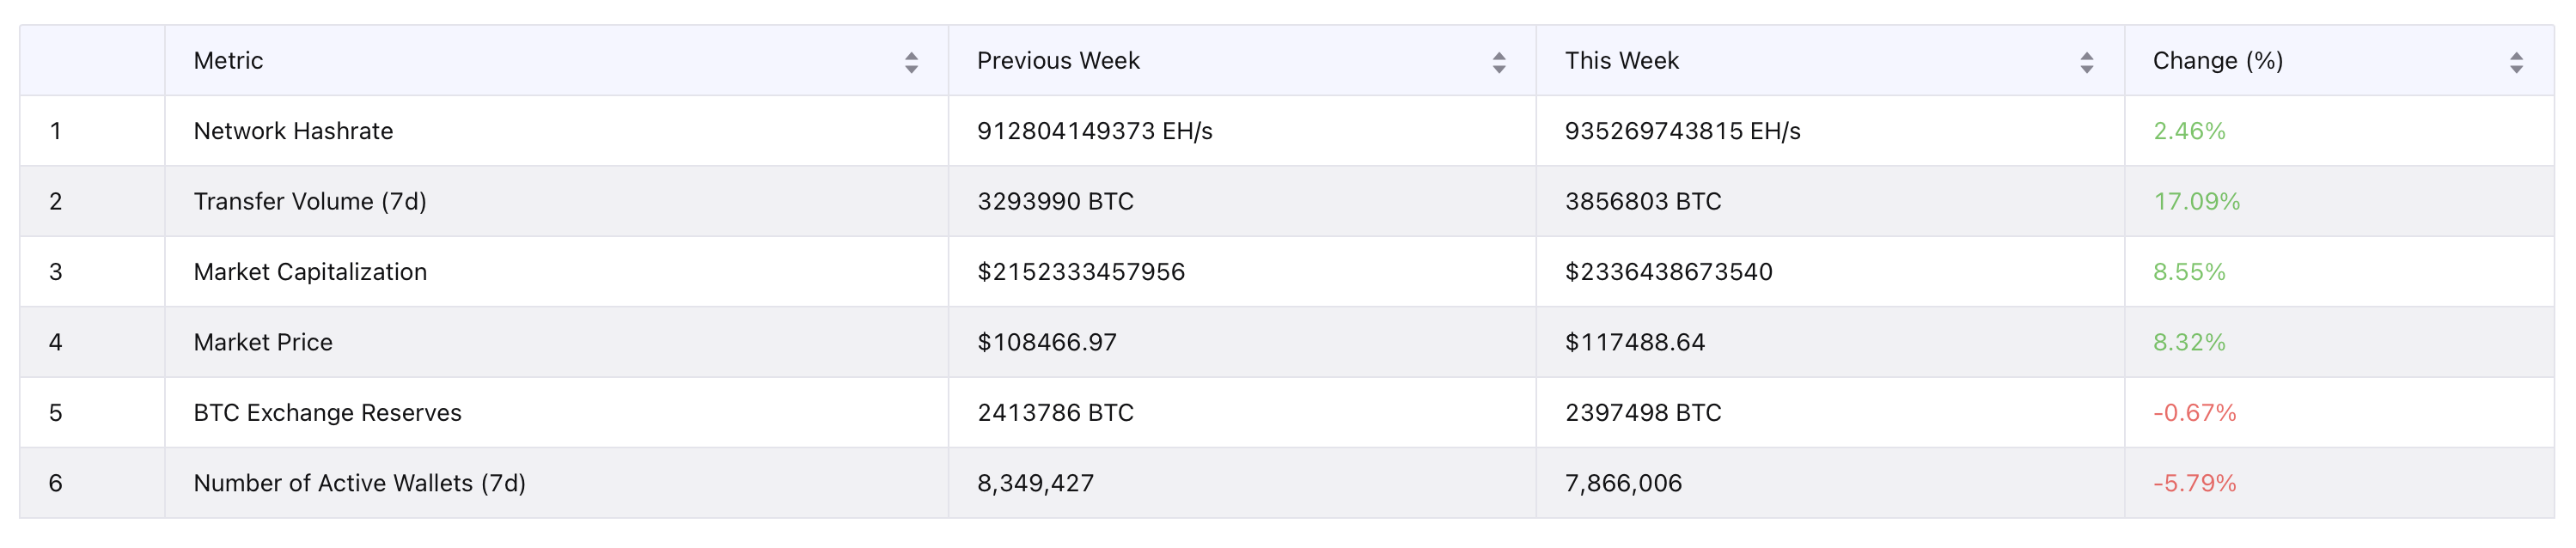
Previous Week: 912,804,149,373 EH/s
This Week: 935,269,743,815 EH/s
Change: 🟢 +2.46%
Comment: Hashrate growth (+2.5%) indicates stable return and expansion of mining capacity, further strengthening network security.
2. Transfer Volume (7d):
Previous Week: 3,293,990 BTC
This Week: 3,856,803 BTC
Change: 🟢 +17.09%
Comment: Significant increase in transfer volumes (+17.1%) indicates activation of on-chain operations due to large transactions.
3. Market Capitalization:
Previous Week: $2,152,333,457,956
This Week: $2,336,438,673,540
Change: 🟢 +8.55%
Comment: Capitalization growth of 8.6% reflects substantial liquidity inflow and strengthening investor confidence.
4. Market Price:
Previous Week: $108,466.97
This Week: $117,488.64
Change: 🟢 +8.32%
Comment: Price rose more than 8%, updating local maximums and confirming powerful bullish impulse.
5. BTC Exchange Reserves:
Previous Week: 2,413,786 BTC
This Week: 2,397,498 BTC
Change: 🔴 −0.67%
Comment: Continuing exchange outflows (−0.7%) strengthens the long-term accumulation trend and reduces available supply for sale.
6. Number of Active Wallets (7d):
Previous Week: 8,349,427
This Week: 7,866,006
Change: 🔴 −5.79%
Comment: Reduction in active addresses (−5.8%) indicates consolidation of retail user positions and focus on strategic holding.
Conclusions
Network security strengthening: hashrate growth (+2.5%) confirms arrival of new mining capacity.
Institutional demand: +17.1% in transfer volumes indicates active participation of large players.
Strong bullish impulse: price (+8.32%) and capitalization (+8.55%) reached new local maximums.
Long-term accumulation: exchange outflows (−0.67%) and reduced active wallets (−5.8%) strengthen foundation for rally continuation.

Price Analysis
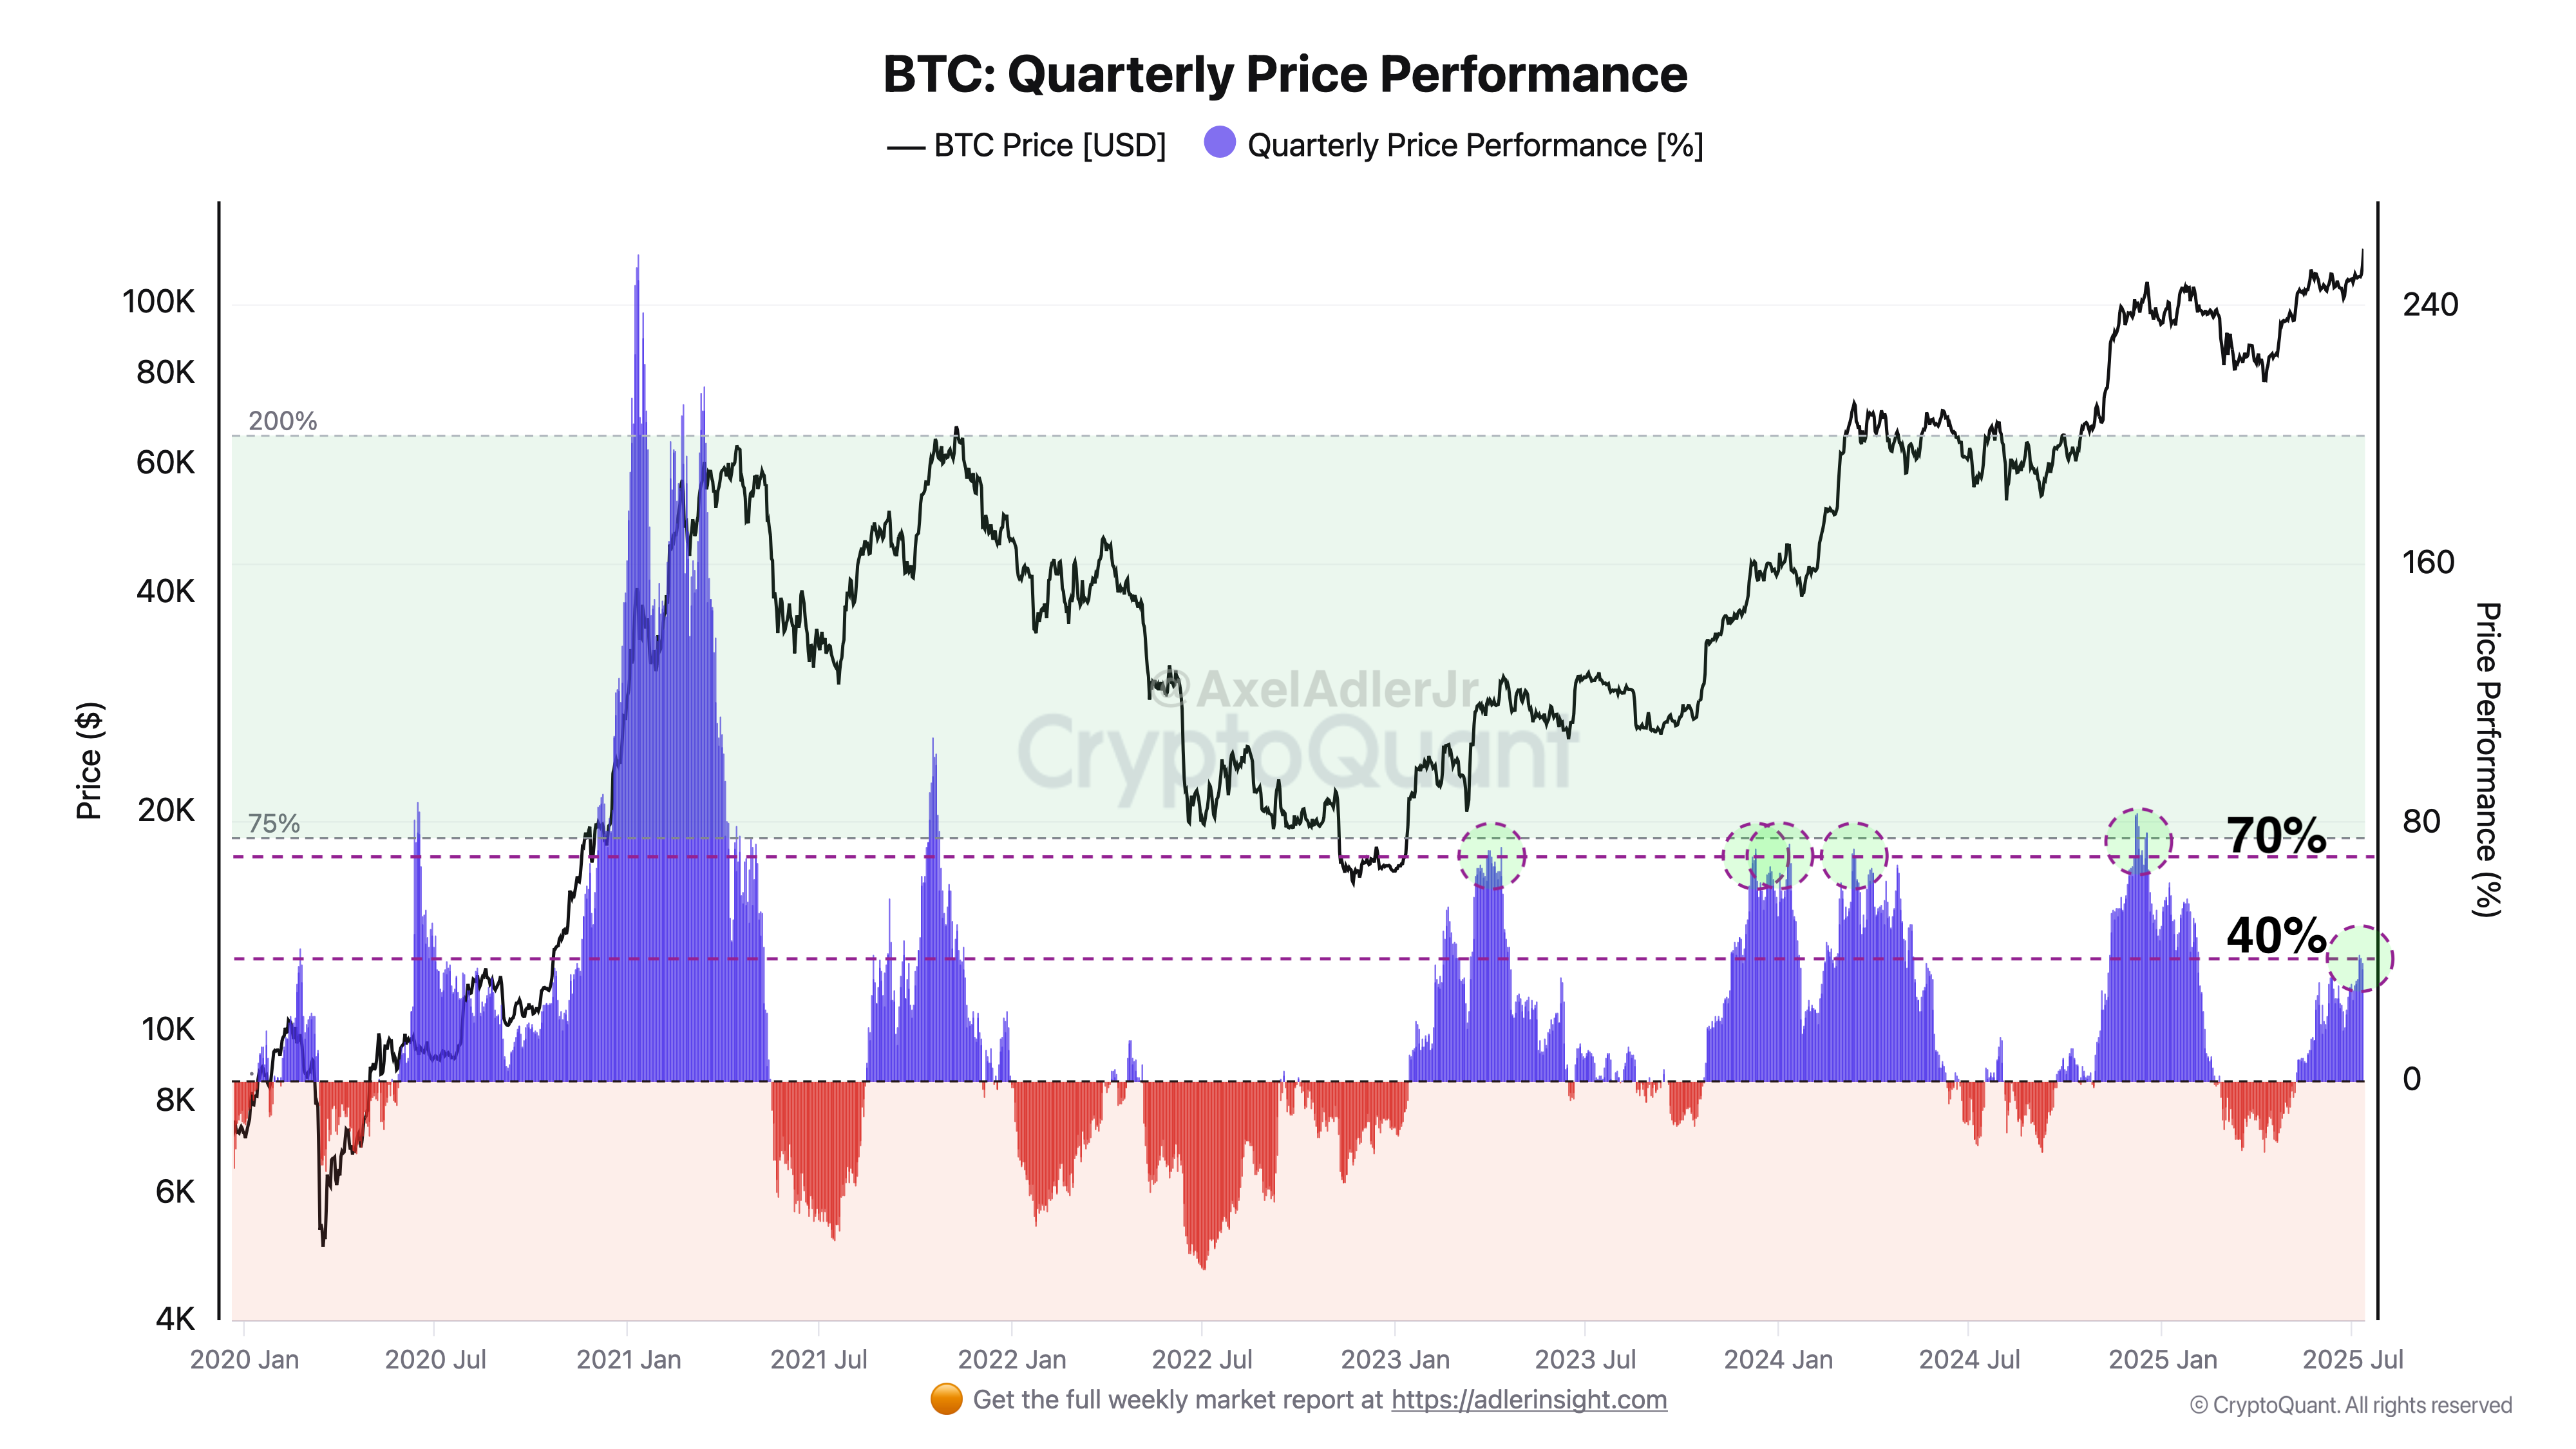
Bitcoin Quarterly Price Performance
In Q2 2025, BTC's quarterly gain was +40%, comparable to similar "bullish" quarters. The 40% threshold serves as a signal – after its breach in previous instances, price continued growing for 1–3 more weeks to local maximums, then the market entered correction. Reaching $130K looks quite probable in the next 1–3 weeks, after which I would expect a short-term correction. For a breakthrough to $150K, a clearer Fed signal or strong institutional capital inflow is needed. The next Fed meeting is scheduled for July 29–30, 2025; it's unlikely the Fed will cut rates before end of July – the chance exists but according to consensus equals 5-7%, so the driver for growth to $150K in the short term will likely be not monetary but speculative activity in the futures market.

On-Chain Metrics
Bitcoin Short-Term Holders HODL Binary Indicator (15D-MA)
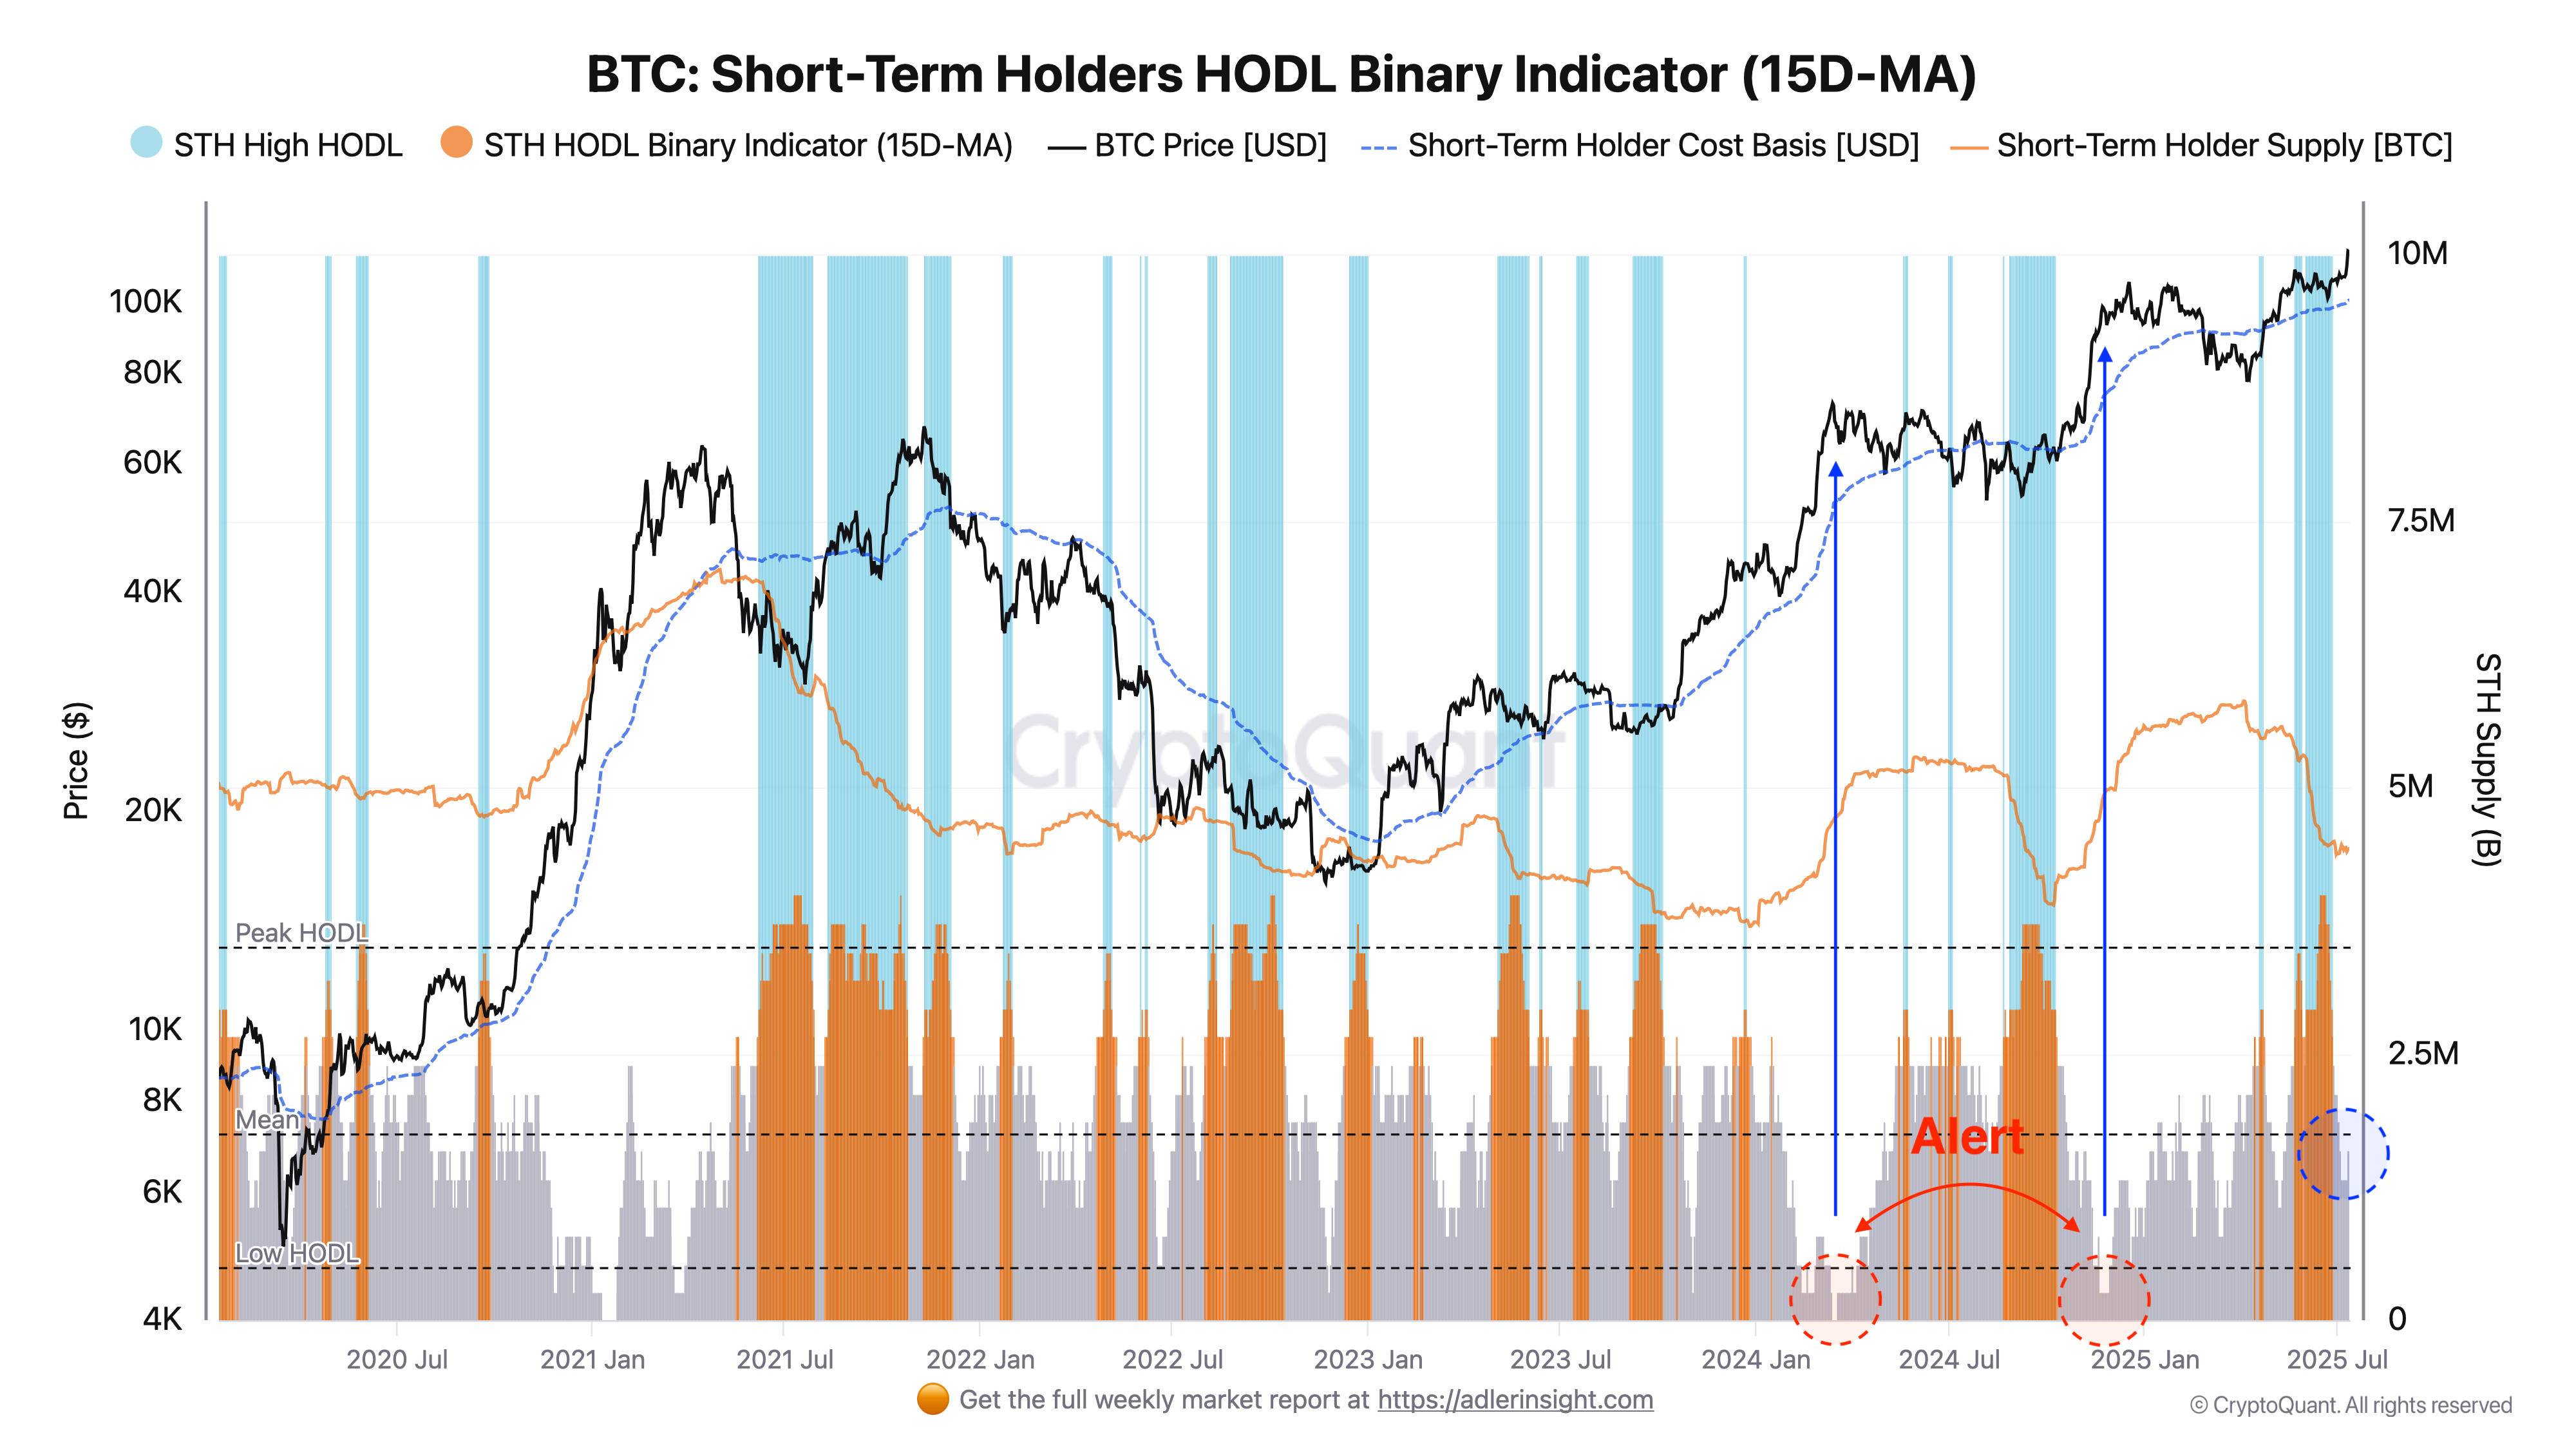
The chart shows that after breaking the $107K mark, short-term holders began taking profits. The 15-day MA binary HODL indicator (orange bars) dropped below average level but is still far from zero. Historical momentum peaks coincided precisely with phases when this indicator moved close to zero, reflecting mass STH sell-offs leading to market reversal and correction.
The key signal point for stopping current growth will be when the indicator approaches zero. This would mean short-term holders begin active selling and stop holding positions, and then bullish momentum will likely completely fade. While the indicator remains in the middle zone, STH pressure is insufficient to stop the rise.
Bitcoin Short-Term Holder NAV Premium Analysis
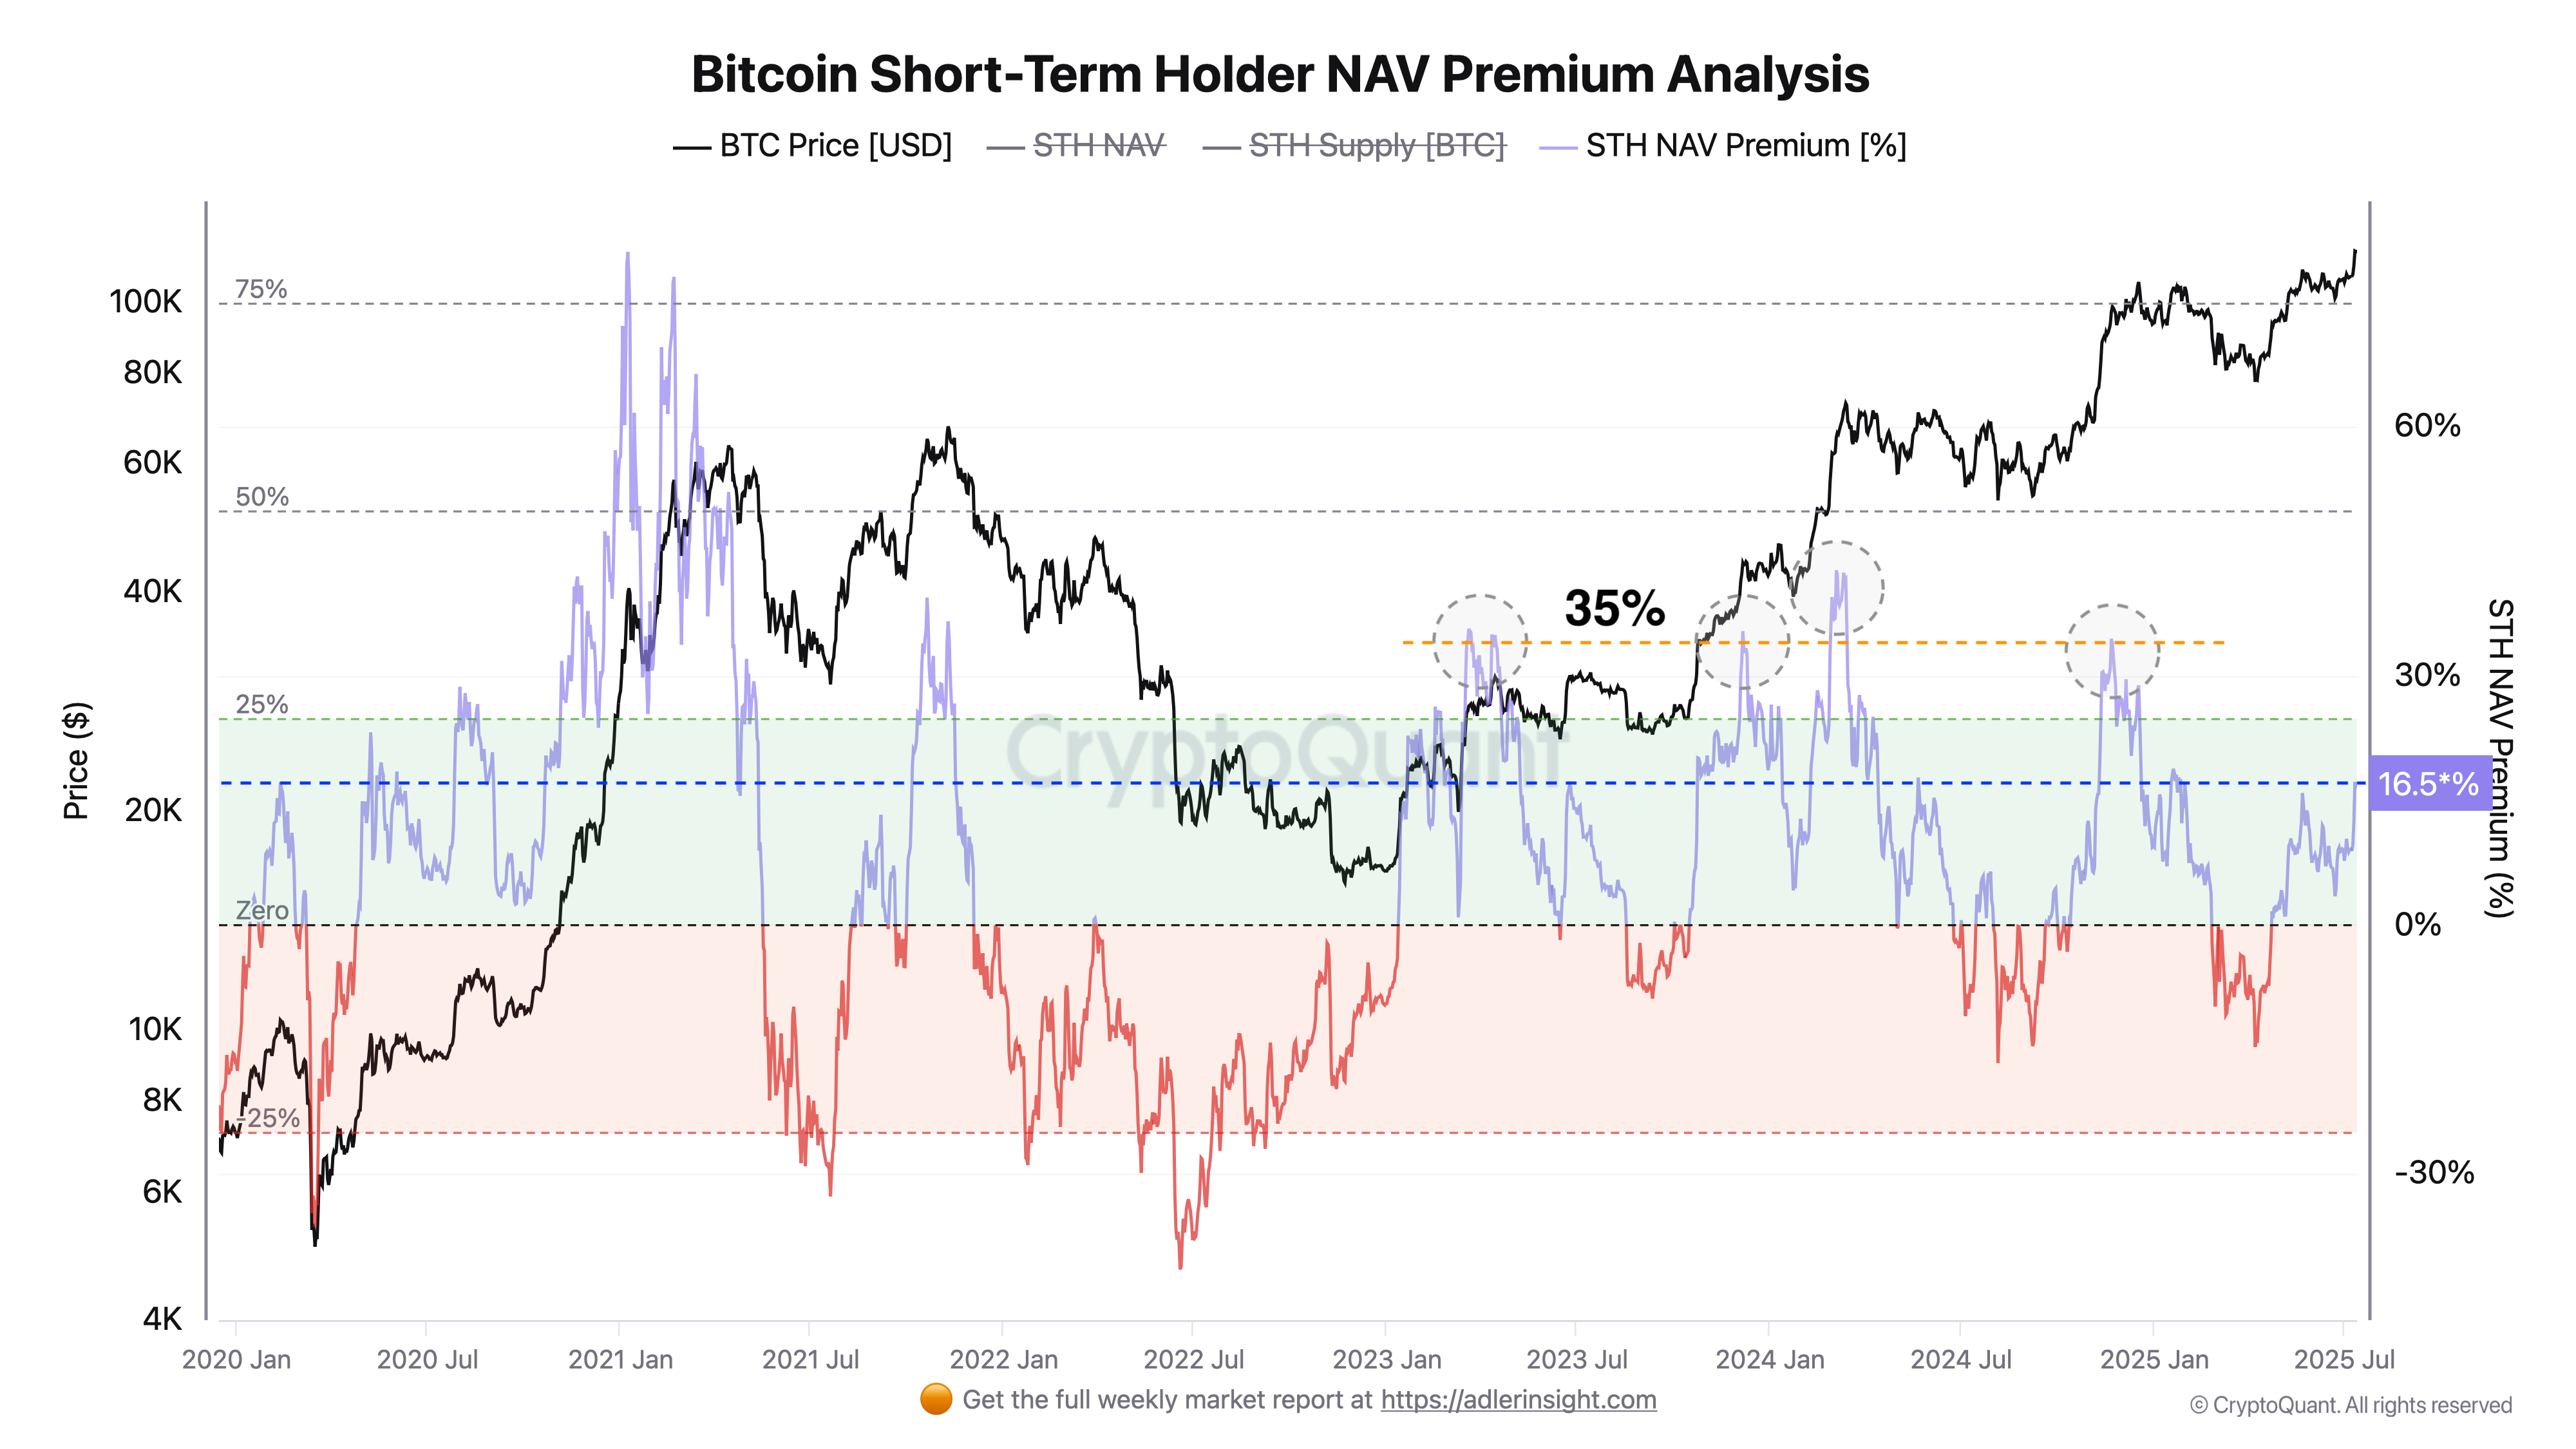
The chart shows dynamics of short-term holders' net asset value (NAV) premium relative to their average cost basis. The metric shows by what percentage current STH portfolio valuation leads (positive values) or lags (negative) behind their basis cost. Red and green backgrounds visually divide "capitulation" zones (NAV premium below 0%) and "moderate" premium (0–25%), while the dotted orange line at 35% signals excessive optimism among short-term holders.
Historically, NAV premium peaks above 30–35% coincided with local price peaks. At this moment, new short-term holders tend to succumb to FOMO, buying coins at high prices. Similarly, periods when premium plunged into negative territory corresponded to phases of strong selling and STH capitulation, serving as local minimum points.
Currently, NAV premium is at 16% in the middle "green" zone of moderate interest. This indicates short-term holders are paying a noticeable but far from extreme premium, and before we see a reversal, values should approach historical peak levels around 30–35%. Until then, potential for further price growth remains.

Conclusion
Institutional demand of $2.72 billion BTC-ETF inflows plus major corporate purchases backed by accelerating hashrate growth and systematic coin outflows from exchanges. All this creates spot supply deficit which, combined with sustainable 30-day momentum and call options dominance at $120–130K, strengthens the probability of rally continuation. While holding key $110K support, the base scenario remains: quick test of $120K zone, which may be followed by a push to $125–130K within 1–3 weeks.

Next Week Forecast
Investment recommendations: 🟢 OUTPERFORM (Moderate Buy)
More details about the rating can be found at this link: https://adlerinsight.com/Adler_Insight_Rating.pdf
Good luck in the upcoming trading week!
AAJ
Disclaimer:
This material has been prepared solely for informational purposes and does not constitute an offer, recommendation, or solicitation to buy or sell any securities, digital assets, or other financial instruments. The information presented in this report is considered reliable; however, its accuracy or completeness is not guaranteed. Past performance is not indicative of future results. Any investment decisions are made by the investor independently, taking into account personal financial circumstances and, if necessary, after consultation with a qualified professional. The author and affiliated parties may hold positions in the assets mentioned in this report. The author and publisher accept no responsibility for any direct or indirect losses arising from the use of this information.
Risks:
High volatility may lead to sharp fluctuations in value, adversely affecting investors' portfolios. Significant price swings may reduce the attractiveness of BTC to institutional investors, especially in the derivatives segment (futures, options). Potential tightening of regulatory requirements by governments and central banks may restrict access to BTC markets and reduce liquidity. Issues with custodial services, centralized exchanges, and hacking incidents could undermine confidence in the asset and negatively impact liquidity.