


Bitcoin Trends – W3 August 2025
Bitcoin at ATH: market lies in wait before Jackson Hole - consolidation or start of new impulse?

TL;DR:
TL;DR: BTC spent the week at historical highs in compressed volatility mode. Fundamental picture is stable without overheating: tone is set by spot and derivatives, on-chain is calm. Macro backdrop is mixed: weak dollar supports risk, but price and tariff risks maintain range. Main trigger - Jackson Hole: soft signals will open path upward, hawkish ones will extend sideways action with pullbacks.

Macroeconomics of the past week
Priority: High
USA: PPI (July): +0.9% m/m, core PPI: +0.9% m/m, +3.3% / +3.7% y/y
Conclusion: Sharpest monthly growth since 2022 signals renewed strengthening of price pressure (especially in services) and raises risk of more "hawkish" Fed reaction despite cooling of part of "real" activity.USA: retail sales (July): +0.5% m/m, control group for GDP: +0.5%
Conclusion: Consumer remains resilient: recovery after strong June supports Q3 GDP trajectory, easing fears of sharp demand slowdown.USA: University of Michigan index (prelim., August): 58.6, inflation expectations 1/5 years: 4.9% / 3.9%
Conclusion: Sentiment deteriorated and inflation expectations rose - combination that could restrain consumption and strengthen Fed caution about premature easing.USA: industrial production (July): −0.1% m/m, capacity utilization: 77.5%
Conclusion: Soft decline with stable manufacturing output indicates weak capex cycle; sensitivity to tariffs and rates remains high.
Priority: Moderate
USA: TIC capital flows (June): net inflow $77.8 billion
Conclusion: Sustained non-resident demand for US assets supports dollar liquidity and partially compensates for fiscal-debt overhang.USA: initial jobless claims (last week): 224k, continuing - 1.953 million
Conclusion: Labor market cooling but remains "elastic": layoff pace low, hiring slowing.USA: 10-year yield 4.39%, DXY 98.2 (week −0.8%), MBA 30Y mortgage rate: 6.67% (4-month low), applications +10.9%
Conclusion: Easing of financial conditions through rates and dollar supports rate-sensitive segments (housing, durables), reducing part of macro risk.China: CPI 0.0% y/y, PPI −3.6% y/y; retail +3.7% y/y (6-month low), industrial production +5.7% y/y
Conclusion: Weak domestic demand and continuing price disinflation at "factory gates" restrain global commodity prices but weigh down Asian export cycle.Japan: Q2 GDP: +0.3% q/q; net exports +0.3 pp
Conclusion: Moderate expansion thanks to exports and capex eases regional risks, but tariff effects may manifest with lag.Eurozone: Q2 employment +0.1% q/q; retail (June) +0.3% m/m
Conclusion: Labor market resilient, consumption stabilizing - ECB room for pause after series of cuts looks justified.
Conclusions
Data profile in US remains "mixed": resilient sales and soft production neighbor with cooling sentiment and PPI spike. This maintains baseline scenario of "two Fed cuts by year-end" but raises market sensitivity to new price releases and tariff news. External backdrop is neutral-negative: China deflationary on production and weakening retail, Europe stably sluggish but without deterioration. For risk assets this means short-term variable "tone": support through falling yields and weak dollar, but with ceiling due to risks of renewed inflation acceleration from supply chains and tariffs.

Stock market of the past week
Priority: High
USA: mixed close, but week in positive territory
Conclusion: S&P 500 −0.3% and Nasdaq −0.4% on Friday after brief new highs, Dow +35 pts, while for the week indices gained: S&P 500 +0.9%, Nasdaq +0.8%, Dow +1.7%. Rotation into defensive stories and healthcare (UnitedHealth +12% on Berkshire stake news) compensated for weakness in semiconductors.Semiconductors under pressure (Applied Materials −14%, Nvidia −0.9%)
Conclusion: Cautious forecasts and tariff risks across chip supply chain cooled technology leadership. This narrows market breadth and increases index sensitivity to trade and technology export news.USA: retail sales +0.5% m/m and confidence decline (U. Michigan 58.6)
Conclusion: Consumer spending holds up, but sentiment deterioration amid inflation fears limits multiple upside and strengthens market dependence on soft price/wage data.
Priority: Moderate
Europe: 4th consecutive growth session
Conclusion: STOXX 50/600 positive on hopes of geopolitical de-escalation despite weak China data and individual corporate failures (Pandora −18.4%). Support comes from Fed easing expectations, but "hawkish" PPI spike in US cooled bets on rapid cuts to 90%.US tariff agenda (steel, semiconductors)
Conclusion: Political risk premium rising: cyclicals and global supply chains under pressure, beneficiaries - energy/defense and some local manufacturers. Tech volatility may persist.
Week results
S&P 500: +0.9%
Nasdaq: +0.8%
Dow Jones: +1.7%
Rally held thanks to resilient consumer spending and strong individual reports, but market breadth narrowed due to chip selloff and rising trade risks.
Next week
Rates and CB rhetoric: Jackson Hole Symposium (Powell speech), FOMC minutes publication.
US data: housing indicators (NAHB, starts/permits, home sales), S&P Global PMI.
Globally: flash PMI US/Eurozone/UK/Japan/Australia/India; inflation - UK, Canada, Japan, South Africa.
Central banks: rate decisions in China, Sweden, New Zealand, Indonesia.
Focus on Powell signal, inflation trajectory and tariff news: soft Fed rhetoric and trade de-escalation will support risk appetite; conversely, hawkish signals and tariff intensification raise correction risk in technology and cyclical sectors (industrials, autos, materials, durables).
Week "mixed": in US sharp PPI jump with resilient retail sales and soft production maintains baseline scenario of two Fed cuts by year-end, but raises sensitivity to price releases, yields and dollar declined, mortgages eased - this supported equities though market breadth narrowed due to semiconductor pressure and tariff risks.
External backdrop neutral-negative: China remains deflationary at producer level and weakening on retail, Japan growing moderately, eurozone stabilizing without acceleration. US markets finished week positive, rotation into defense and healthcare partially compensated for tech sector weakness. Result for risk assets: short-term support from easing financial conditions, but "ceiling" due to inflation surprise and trade agenda risks.
Key triggers ahead - Jackson Hole, Fed minutes and PMI. Everything will be decided by Powell signal, inflation trajectory and tariffs. If Powell emphasizes "progress on disinflation" and slowdown risks - markets read this as risk support, if he shifts to "higher-for-longer" due to services/tariffs - correction risk grows, primarily in technology and cyclical sectors.

Important news of the past week
Priority: High
Record BTC/ETH spot ETF volume: $40 billion for the week - driver was ETH-ETFs, rising to top-5 ETF levels by volume.
ETH > $4,700 (+40% YTD) on record demand backdrop: over $9 billion bought in recent months, with corporate "ether treasuries" and ETFs strengthening inflows.
Coinbase closed Deribit acquisition for $2.9 billion, becoming world #1 in derivatives (volume and OI) and cementing US leadership in crypto derivatives.
OKX burns 279 million OKB (→ 21 million in circulation) - large-scale tokenomics restructuring and sharp supply reduction (stated valuation of burned tokens - $26 billion).
BitMine increased treasury to 1.15 million ETH ($4.9 billion), strengthening status as largest public ether holder, corporate ETH treasuries reached $13 billion.
Priority: Moderate
Regulatory strengthening in Hong Kong: SFC introduces enhanced cold storage and real-time monitoring requirements for licensed exchanges.
Google Play requires FinCEN/state licenses/MiCA for crypto wallets, effectively closing access for most non-custodial applications.
US Treasury: strategic BTC reserve not planned, but seized assets $15–20 billion will remain on balance sheet.
Pantera invests >$300 million in digital treasury companies (DAT) - bet that "treasury" strategies will outperform tokens.
Metaplanet acquired 518 BTC for $61.4 million - total balance 18,113 BTC ($1.85 billion), 6th place among public holders.
ETHZilla +90% on Peter Thiel stake news (7.5%): portfolio revealed 82,186 ETH ($349 million) + $238 million cash.
Priority: Low
Bit Digital: Q2 revenue −11.7% to $25.7 million, profit $14.9 million - shift in focus from BTC mining to ETH treasury and staking.
Norwegian sovereign wealth fund indirectly owns 7,161 BTC ($863 million) through stakes in Strategy, Block, Coinbase, MARA and Metaplanet.
Smarter Web Company bought 295 BTC for $35.2 million - total balance 2,395 BTC ($285 million), 23rd place among public treasuries.
Strategy added 155 BTC (5-year plan anniversary) - total balance 628,946 BTC (> $74 billion).
ETH exceeded $4,300 on corporate Ether bond growth to $13 billion - support provided by BitMine, SharpLink and The Ether Machine.
El Salvador authorized investment banks to hold BTC and provide crypto services to accredited investors, strengthening foreign player interest.
Conclusions
Week's main driver - institutional ETH demand. Record ETF volumes, inflows and corporate treasury expansion (BitMine, SharpLink, Ether Machine) strengthen "ether" bull thesis and support price.
Infrastructure rapidly institutionalizing. Coinbase's Deribit acquisition - turning point for derivatives, enhanced SFC norms and strict Google Play requirements form "entry threshold" for providers.
Individual token supply tightening. Aggressive OKB burn radically reduces circulation and may change risk/return structure for OKX ecosystem holders.
Government structures take pragmatic position. US not forming BTC reserve but retaining seized assets. Europe and Asia tightening oversight - while private sector increases digital asset balances.
Bitcoin treasuries continue growing, but focus shifts to ether. Public companies and funds more actively diversifying into ETH, raising probability of maintaining bipolar market structure (BTC as "reserve", ETH as "productive" asset).

Bitcoin trading week macro analysis
1. BTC/USD pair analysis
Key indicators for the week
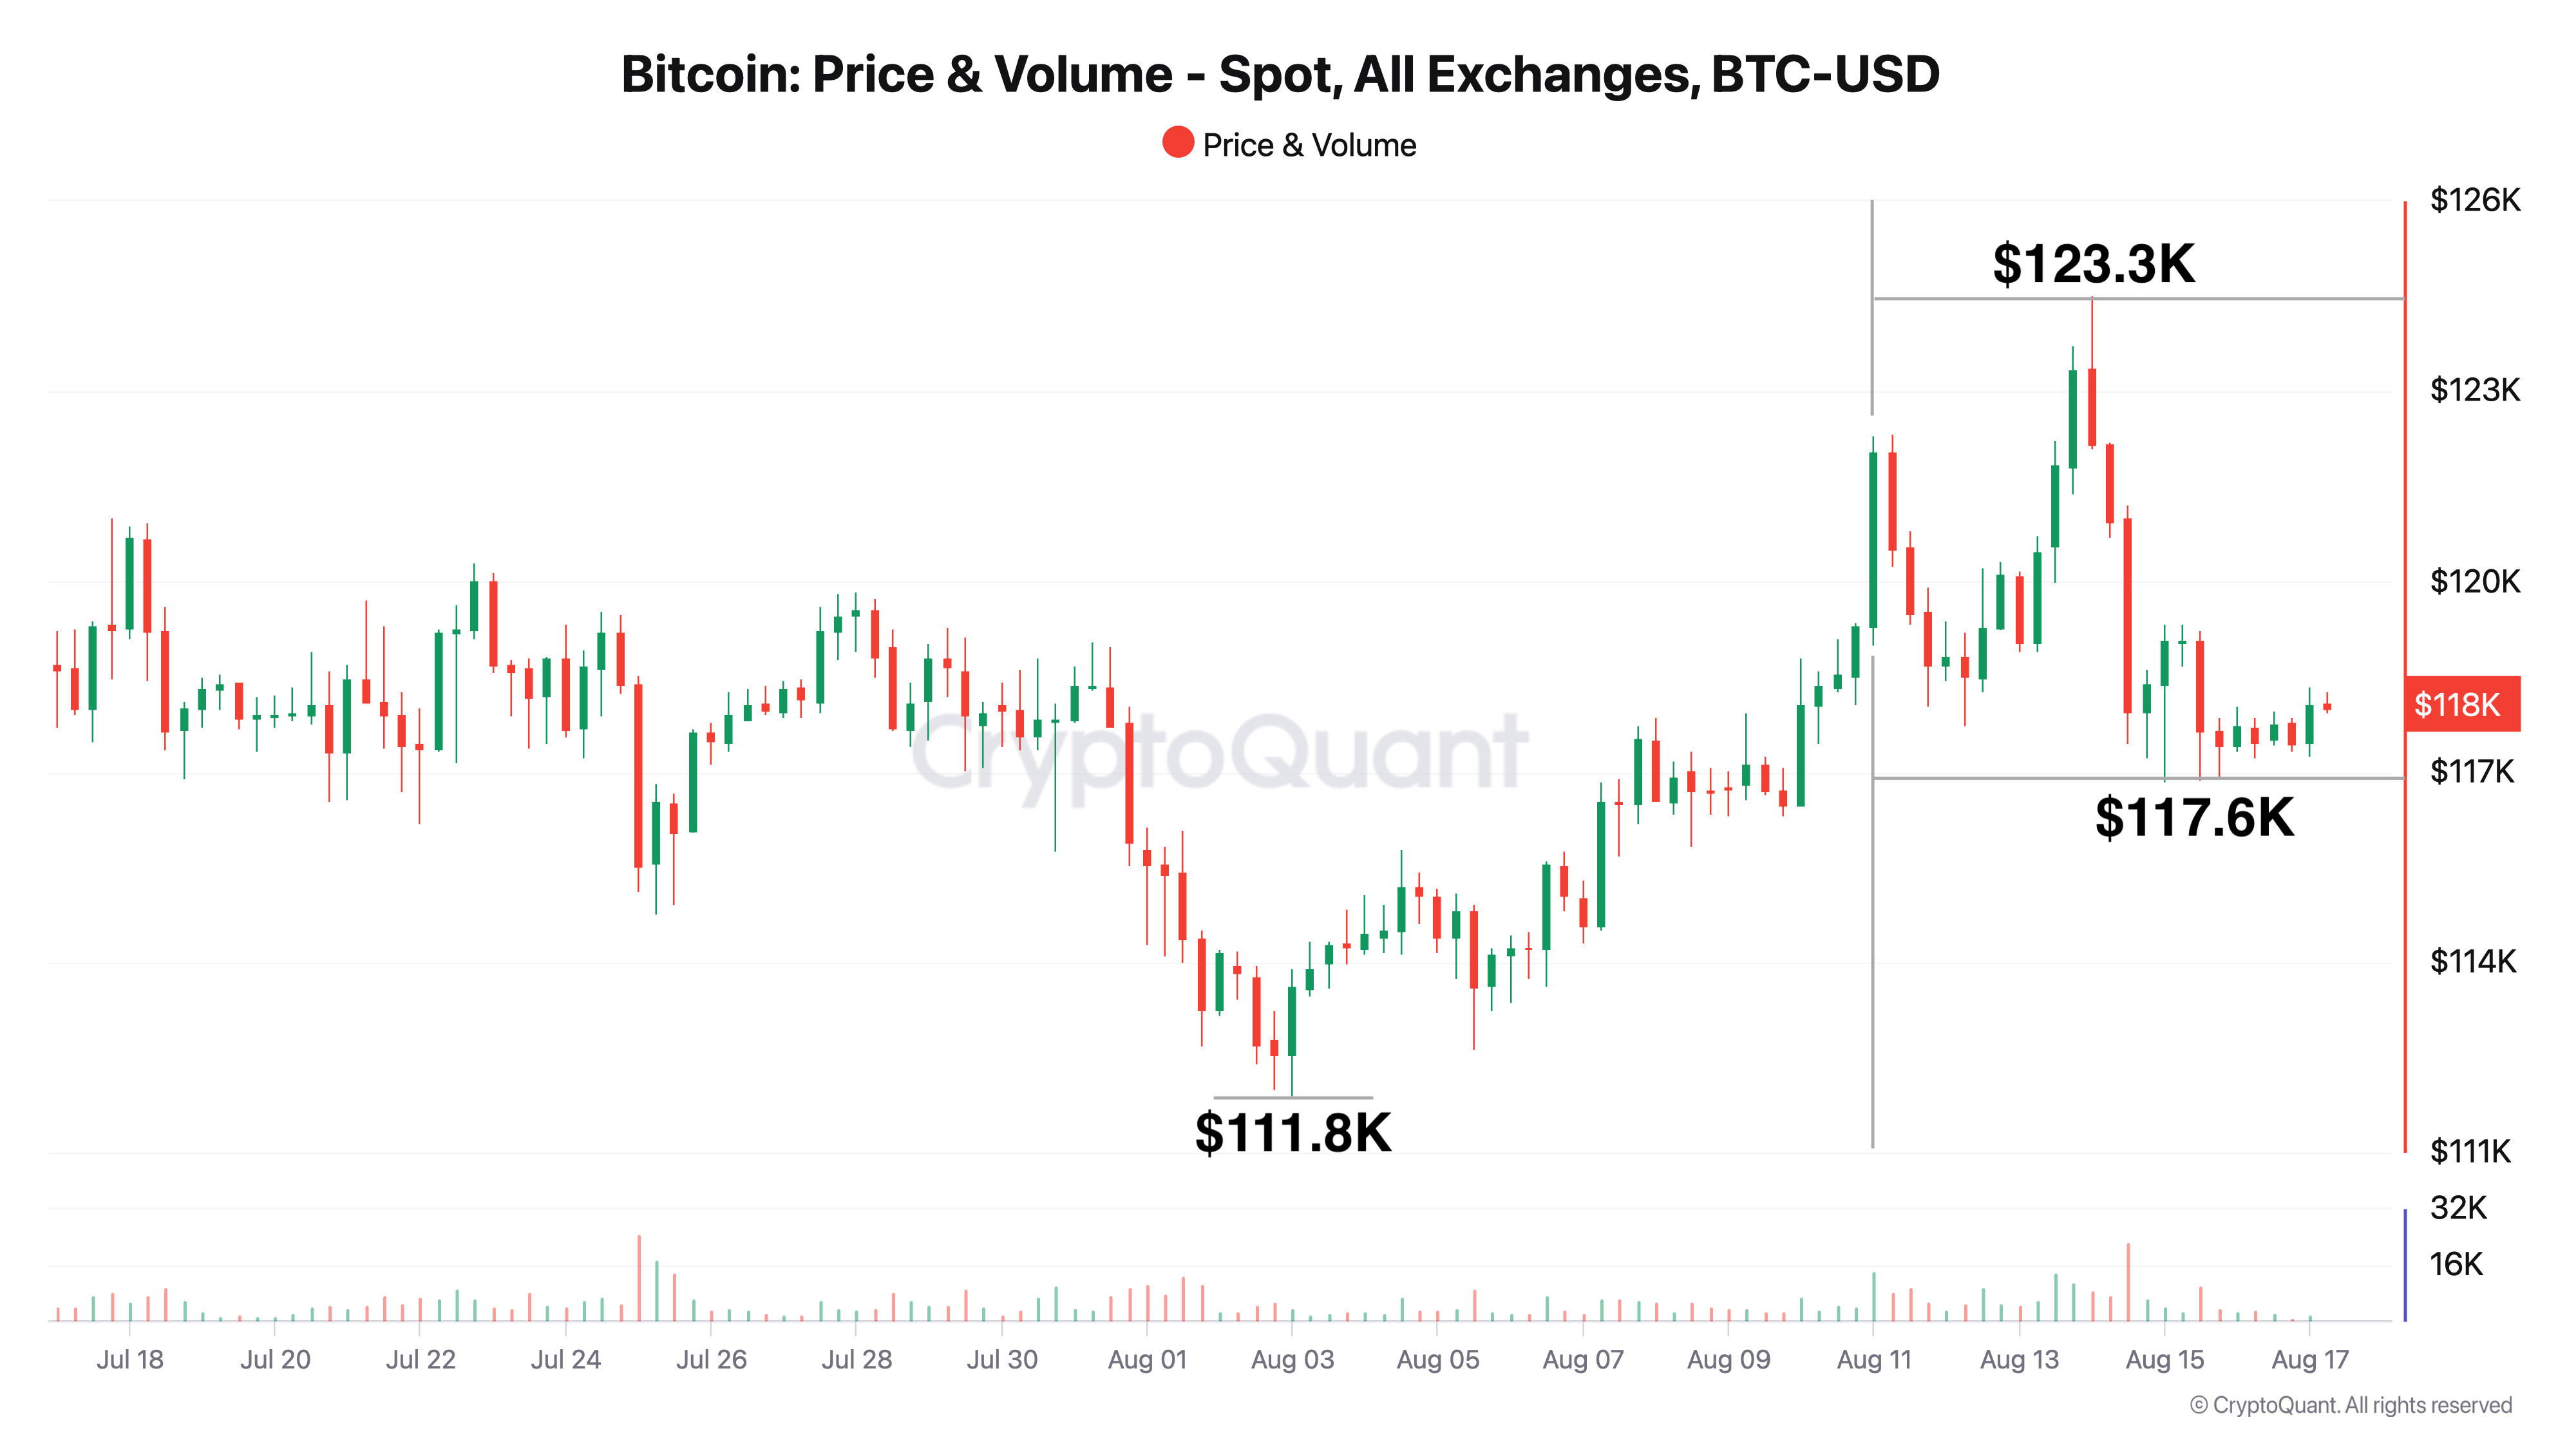
Current price: $118.0K
Local high: $123.3K
Local low: $117.6K
Trend
After week start BTC made impulse to $123.3K, where quick profit-taking followed and pullback to $117.6K. Buyers defended support and price moved into tight consolidation $117.6K–$118.5K on declining volumes - typical accumulation phase after failed upper boundary breakout.
Spike to $123.3K accompanied by volume growth and subsequent pullback.
Support $117.6K held, forming series of higher intraday lows.
Declining volatility and volumes indicate balance of forces and preparation for next impulse.
Conclusions
Key resistance: $123.3K - confident breakout on rising volumes will open path to $125–$127K.
Local support: $117.6K - level hold will preserve bullish scenario; loss opens road to $116K.
Strong base support: $111.8K - key swing low, close below becomes signal for medium-term strategy revision.
2. Bitcoin Price Momentum (30-day)
This week's analysis
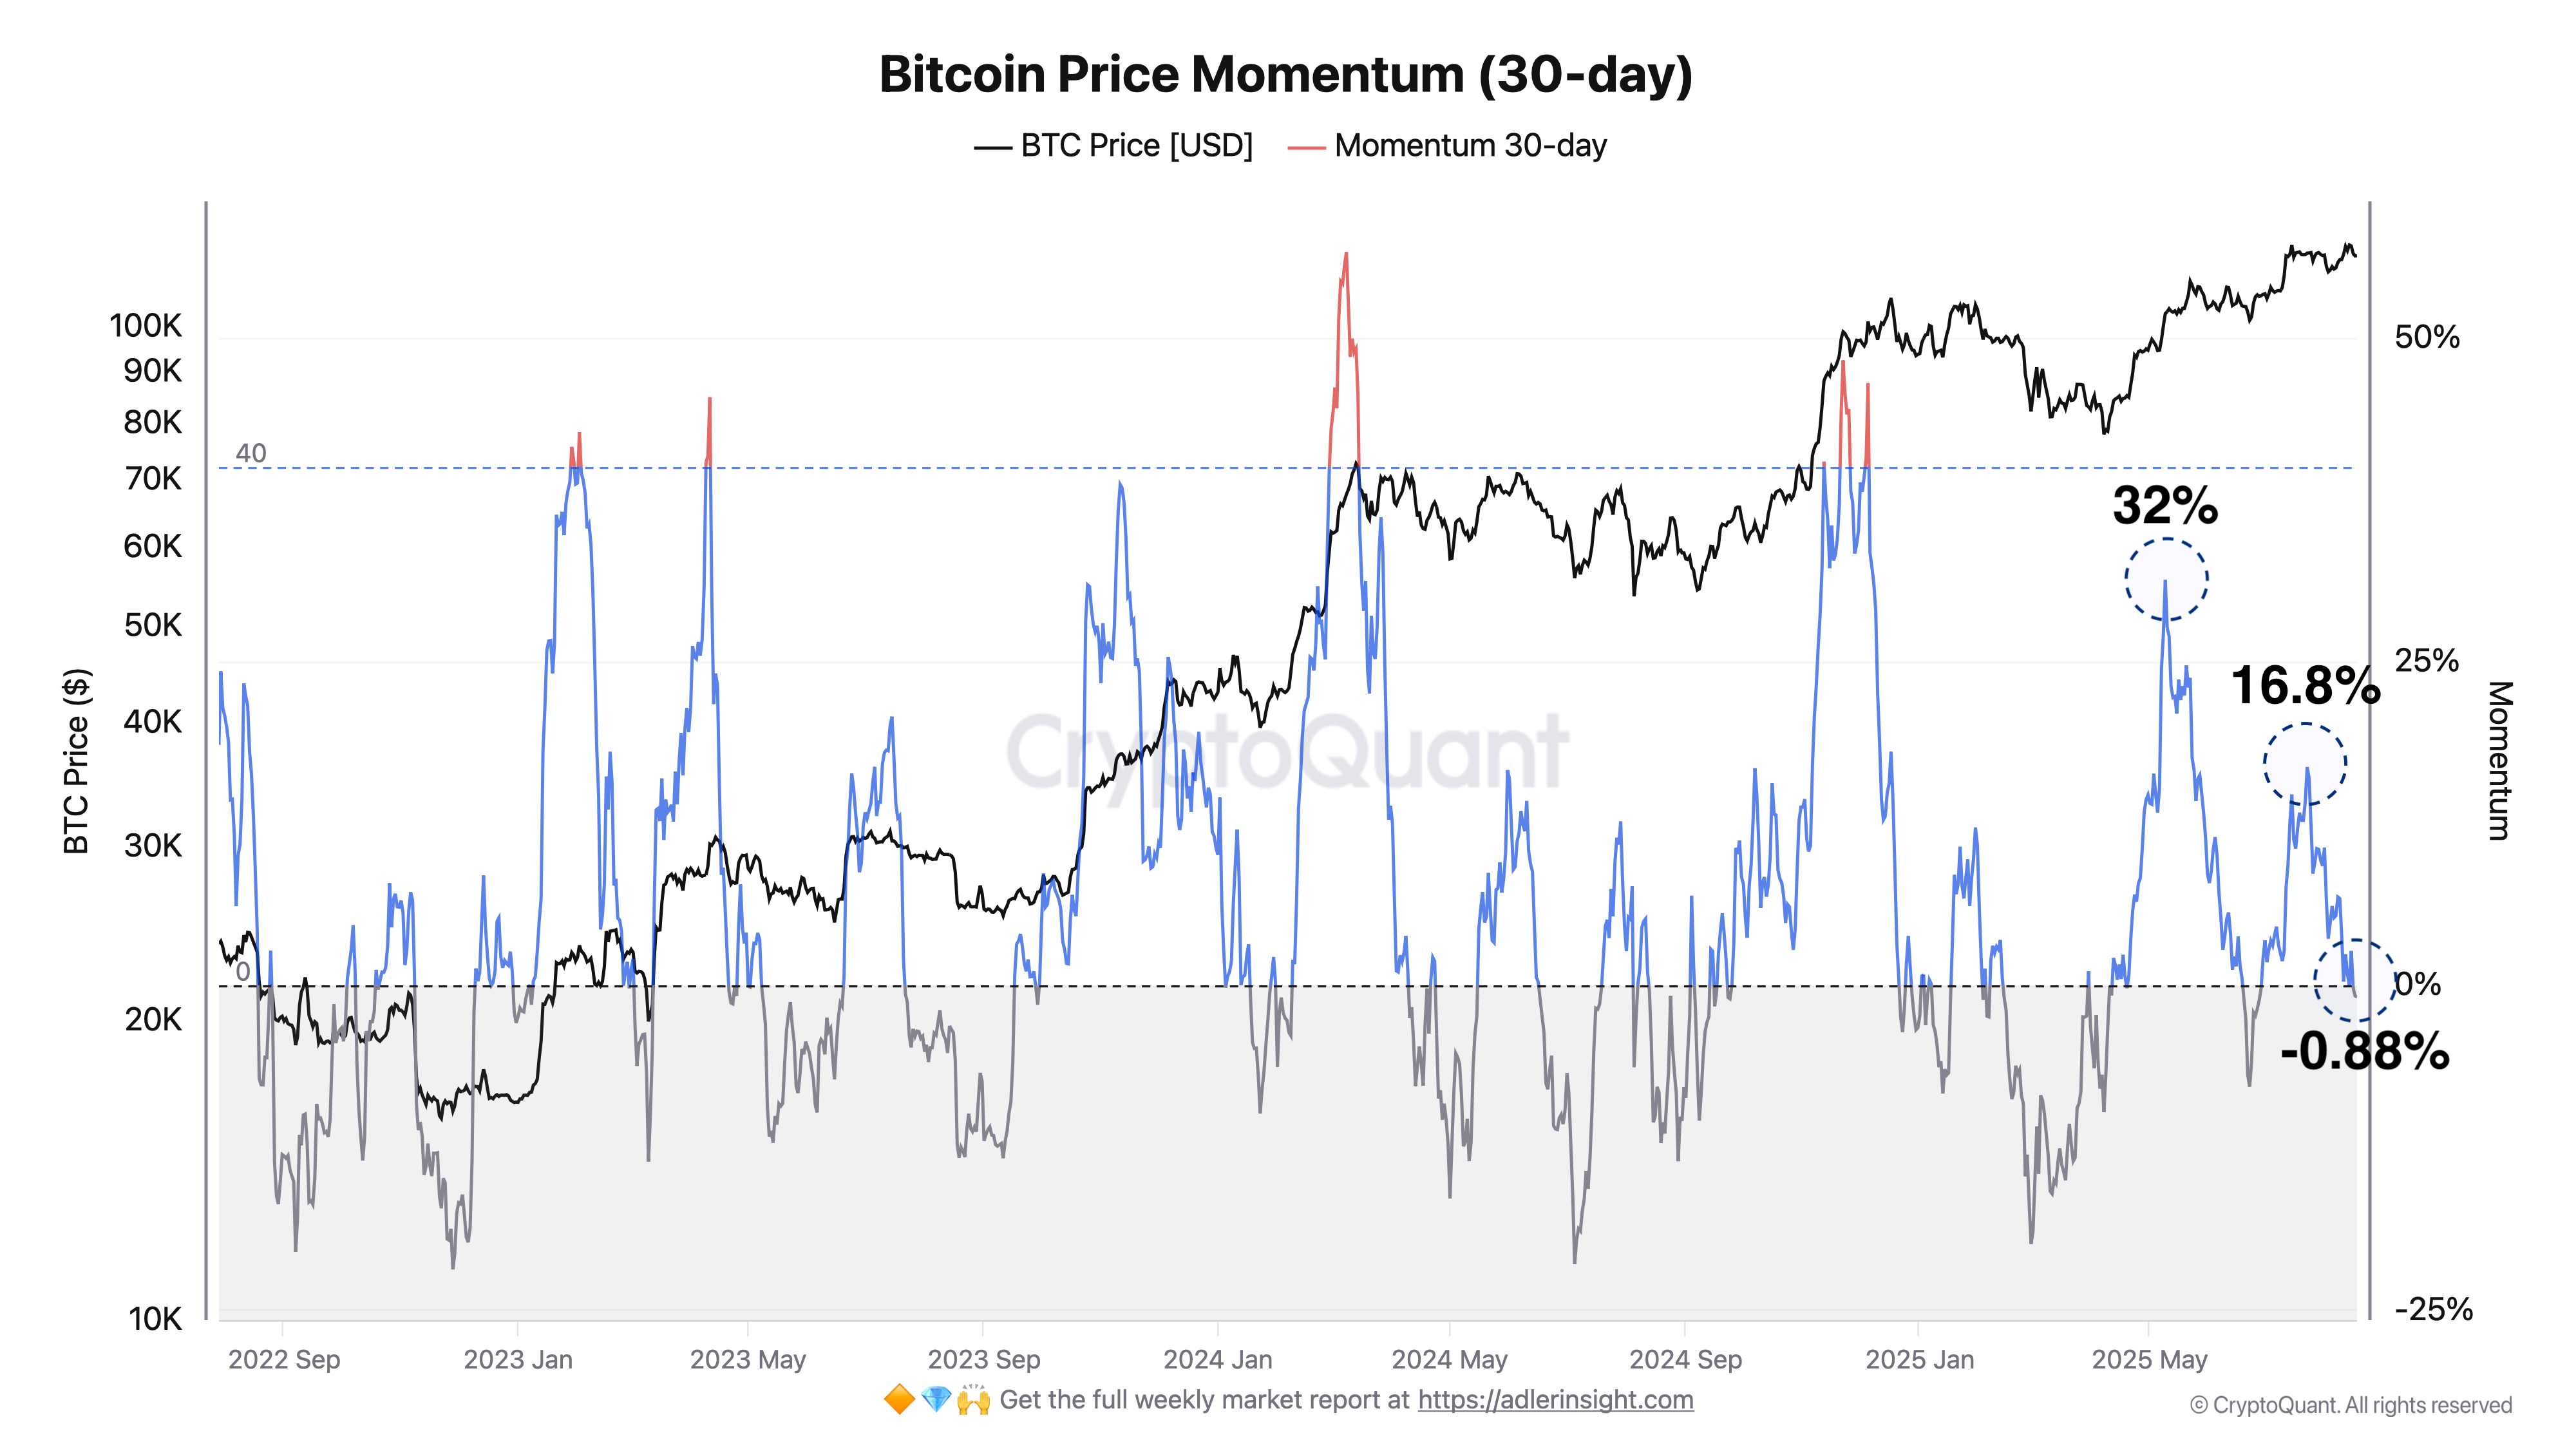
This week 30-day momentum declined from 0% to −0.9%, moving into negative territory. This confirms fading upward acceleration and market shift to cautious consolidation/correction phase.
Conclusions
Momentum below zero (−0.9%) - short-term advantage with sellers, increases risk of sideways with downward bias.
While momentum holds in 0−5% corridor, "choppy" action likely, drop below −5% will strengthen developing correction signal.
Bullish momentum return will require recovery above +5–8% (preferably ≥10%), indicating renewed buyer initiative capture.
3. Options Analysis
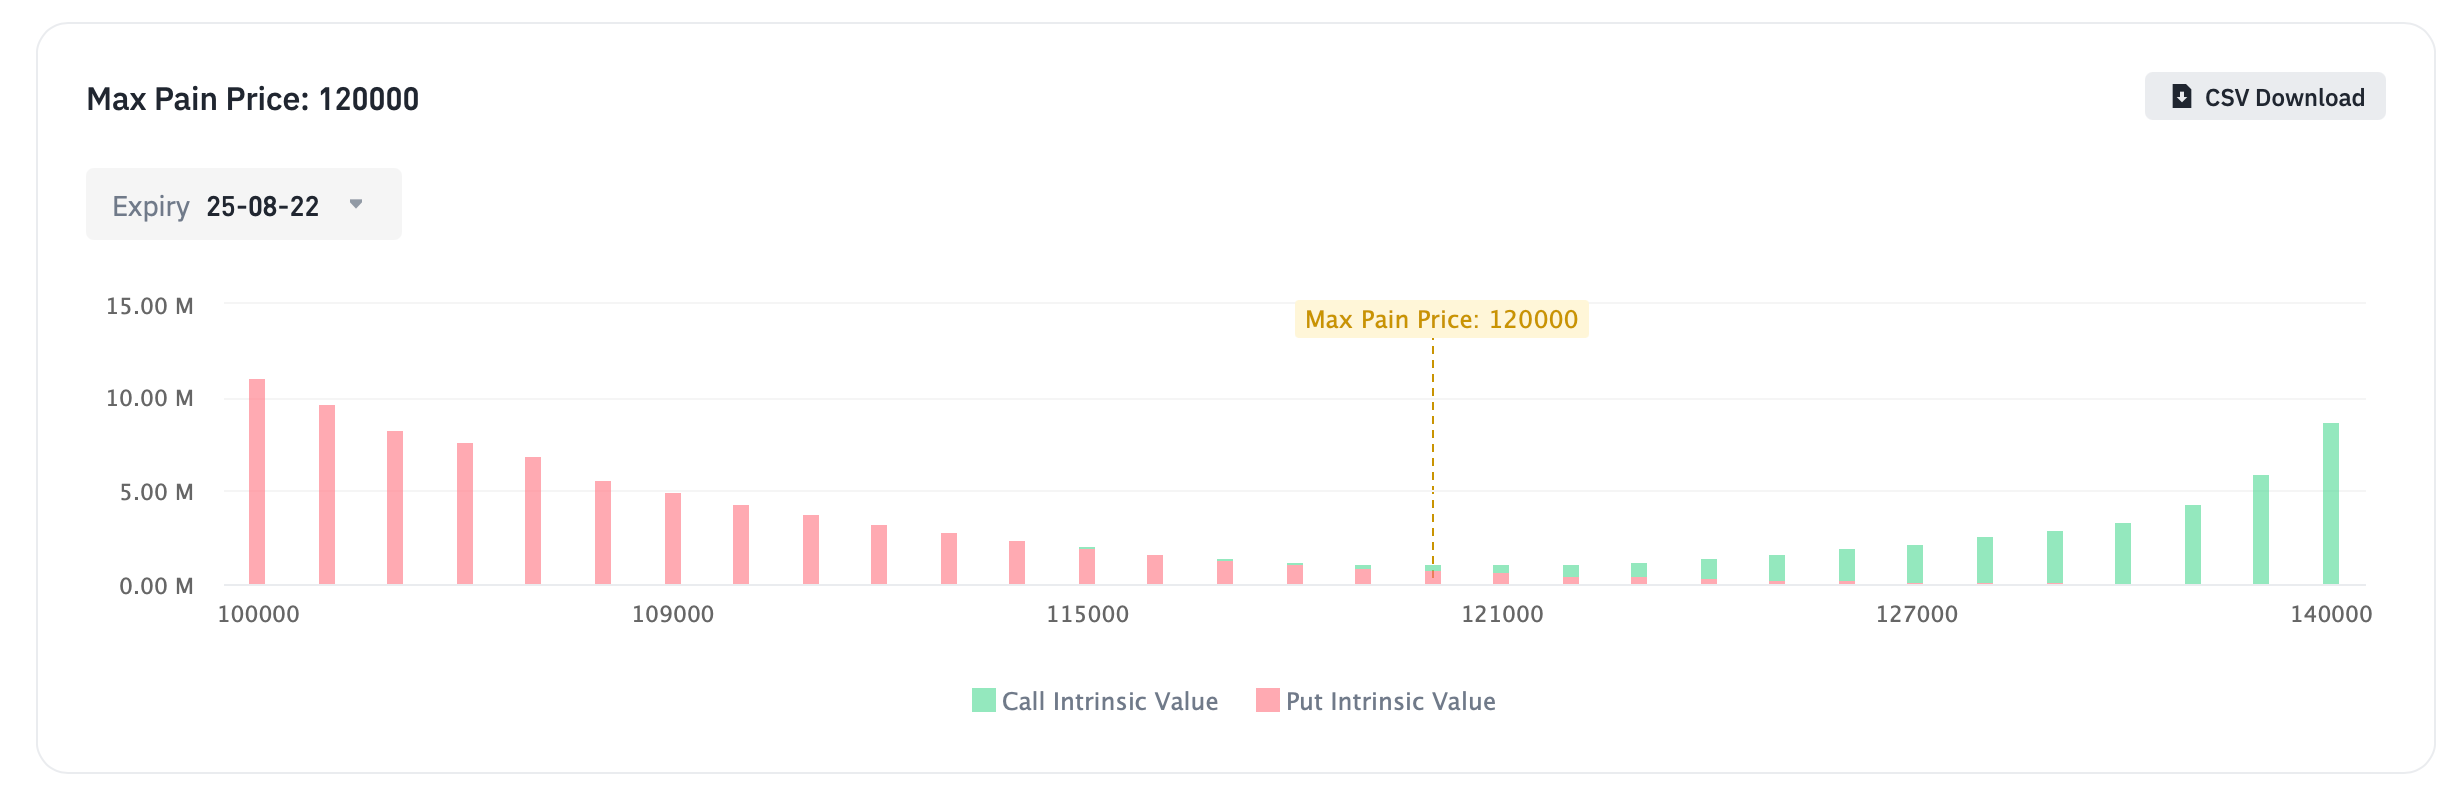
Max Pain Price: $120,000
Expiration date: August 22, 2025
Market structure
Call option dominance (green bars):
Interest shifted further OTM, right tail noticeably thickens. Key clusters:$140,000: ≈ 8.5–9.0M (largest volume)
$139,000: ≈ 5.5–6.0M
$138,000: ≈ 4.3–4.8M
$137,000: ≈ 3.2–3.6M
$135–136,000: ≈ 2.1–2.8M
Below $130,000 volumes noticeably smaller (around ~1.5–2.0M), emphasizing bet on distant upside.
Put options (red bars):
Left tail dominates and smoothly fades to strikes above 115K. Clusters:$100,000: ≈ 10.8–11.2M (maximum)
$101–102,000: ≈ 8.5–10.0M
$105–109,000: ≈ 5.0–7.0M
$112–115,000: ≈ 1.7–3.0M
Above ~$121,000 red bars insignificant (typically <~0.5M).
Comparison with previous week
Max Pain shifted up: from $118K → $120K (+2K), reflecting moderate bullish distribution drift.
Call strengthened on right: demand peak shifted further - from $131–133K to $138–140K, where largest volumes now concentrate.
Put "wall" stable at $100K: protection around $100–105K remains powerful, in $110–115K zone volumes thinner than week before.
Distribution shape closer to "U": heavy tails at edges with "pin" around $120K until expiration.
Forecast
Bullish scenario:
Close above $120K and call inflow in $125–130K range opens test of $123–125K, breakout - road to $130–133K.Bearish scenario:
Drop below $120K amid Put growth in $112.5–115K corridor strengthens "magnet" to $115–112.5K, extreme support - $100–105K cluster.

Bitcoin network data analysis for this week
1. Market Capitalization
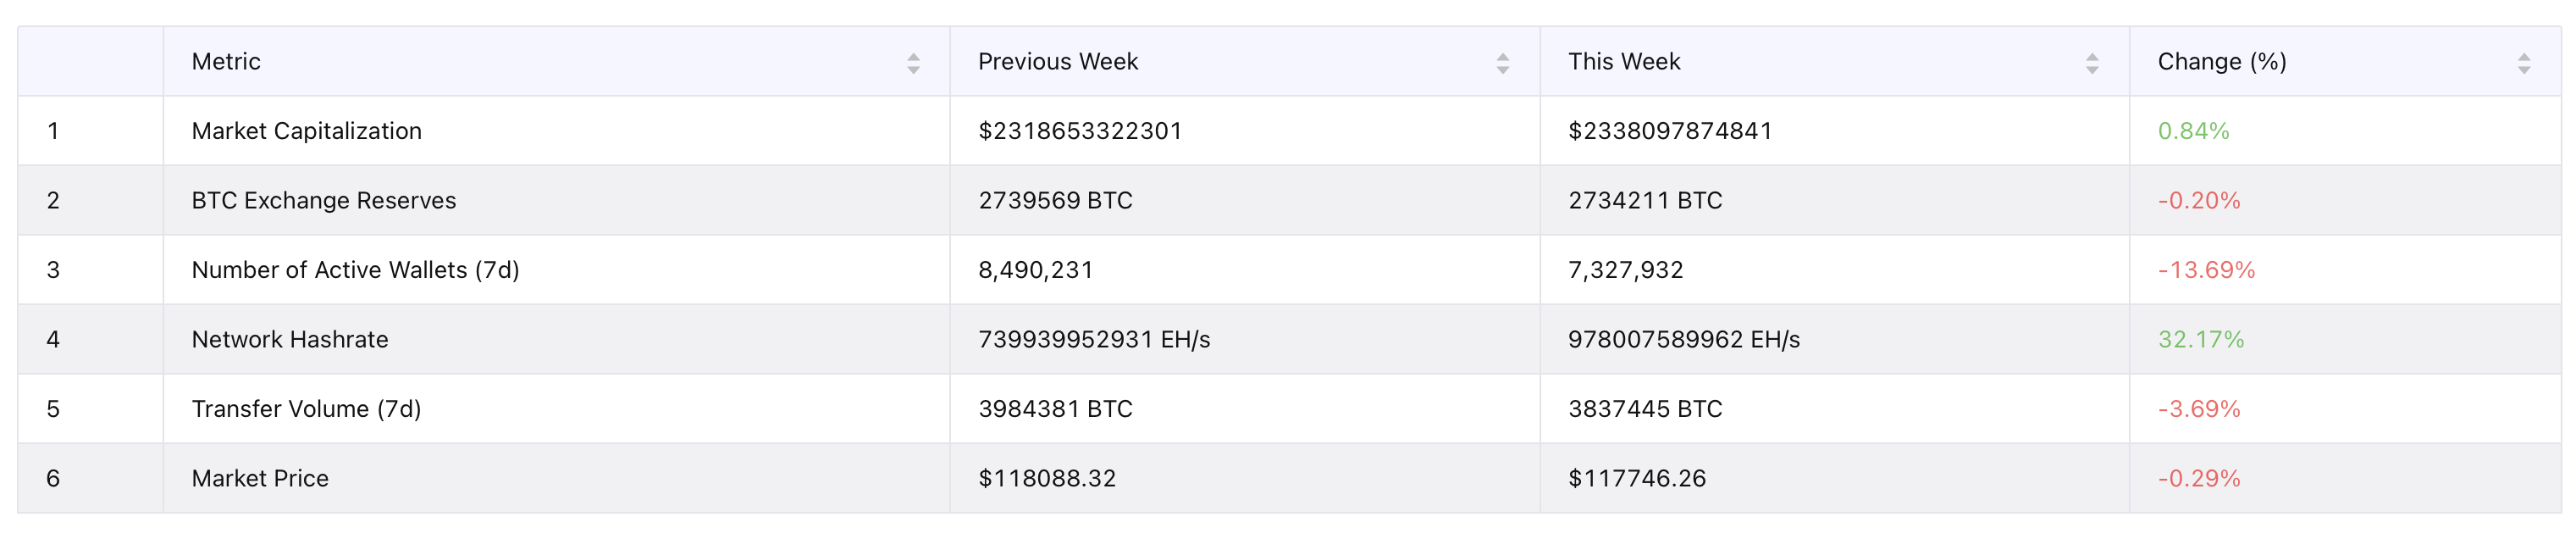
Previous Week: $2,318,653,322,301
This Week: $2,338,097,874,841
Change: 🟢 +0.84%
Comment: Moderate cap growth with weak on-chain activity indicates liquidity inflow primarily through spot/derivatives.
2. BTC Exchange Reserves
Previous Week: 2,739,569 BTC
This Week: 2,734,211 BTC
Change: 🔴 −0.20%
Comment: Light exchange outflow continues accumulation trend and reduces current supply.
3. Number of Active Wallets (7d)
Previous Week: 8,490,231
This Week: 7,327,932
Change: 🔴 −13.69%
Comment: Sharp address activity decline reflects consolidation and retail caution.
4. Network Hashrate
Previous Week: 739,939,952,931 EH/s
This Week: 978,007,589,962 EH/s
Change: 🟢 +32.17%
Comment: Strong hashrate jump indicates capacity return/connection (possibly seasonal factor and new equipment deployment), increasing network security.
5. Transfer Volume (7d)
Previous Week: 3,984,381 BTC
This Week: 3,837,445 BTC
Change: 🔴 −3.69%
Comment: Small on-chain turnover decline confirms "waiting" phase.
6. Market Price
Previous Week: $118,088.32
This Week: $117,746.26
Change: 🔴 −0.29%
Comment: Price practically stable, fluctuating in narrow range.
Conclusions
Metrics divergence: with strong hashrate growth (+32%) price and transfer volumes remain low - market looks cautious, drivers come from exchanges rather than on-chain.
Supply factor: small exchange outflow (−0.20%) limits available supply and supports price absent retail activity.
What to watch next: recovery in active wallet numbers and on-chain volume growth amid continuing reserve decline - bullish signal, reserve growth with weak activity - local price pressure risk.

Price analysis
Bitcoin Trend vs Consolidation
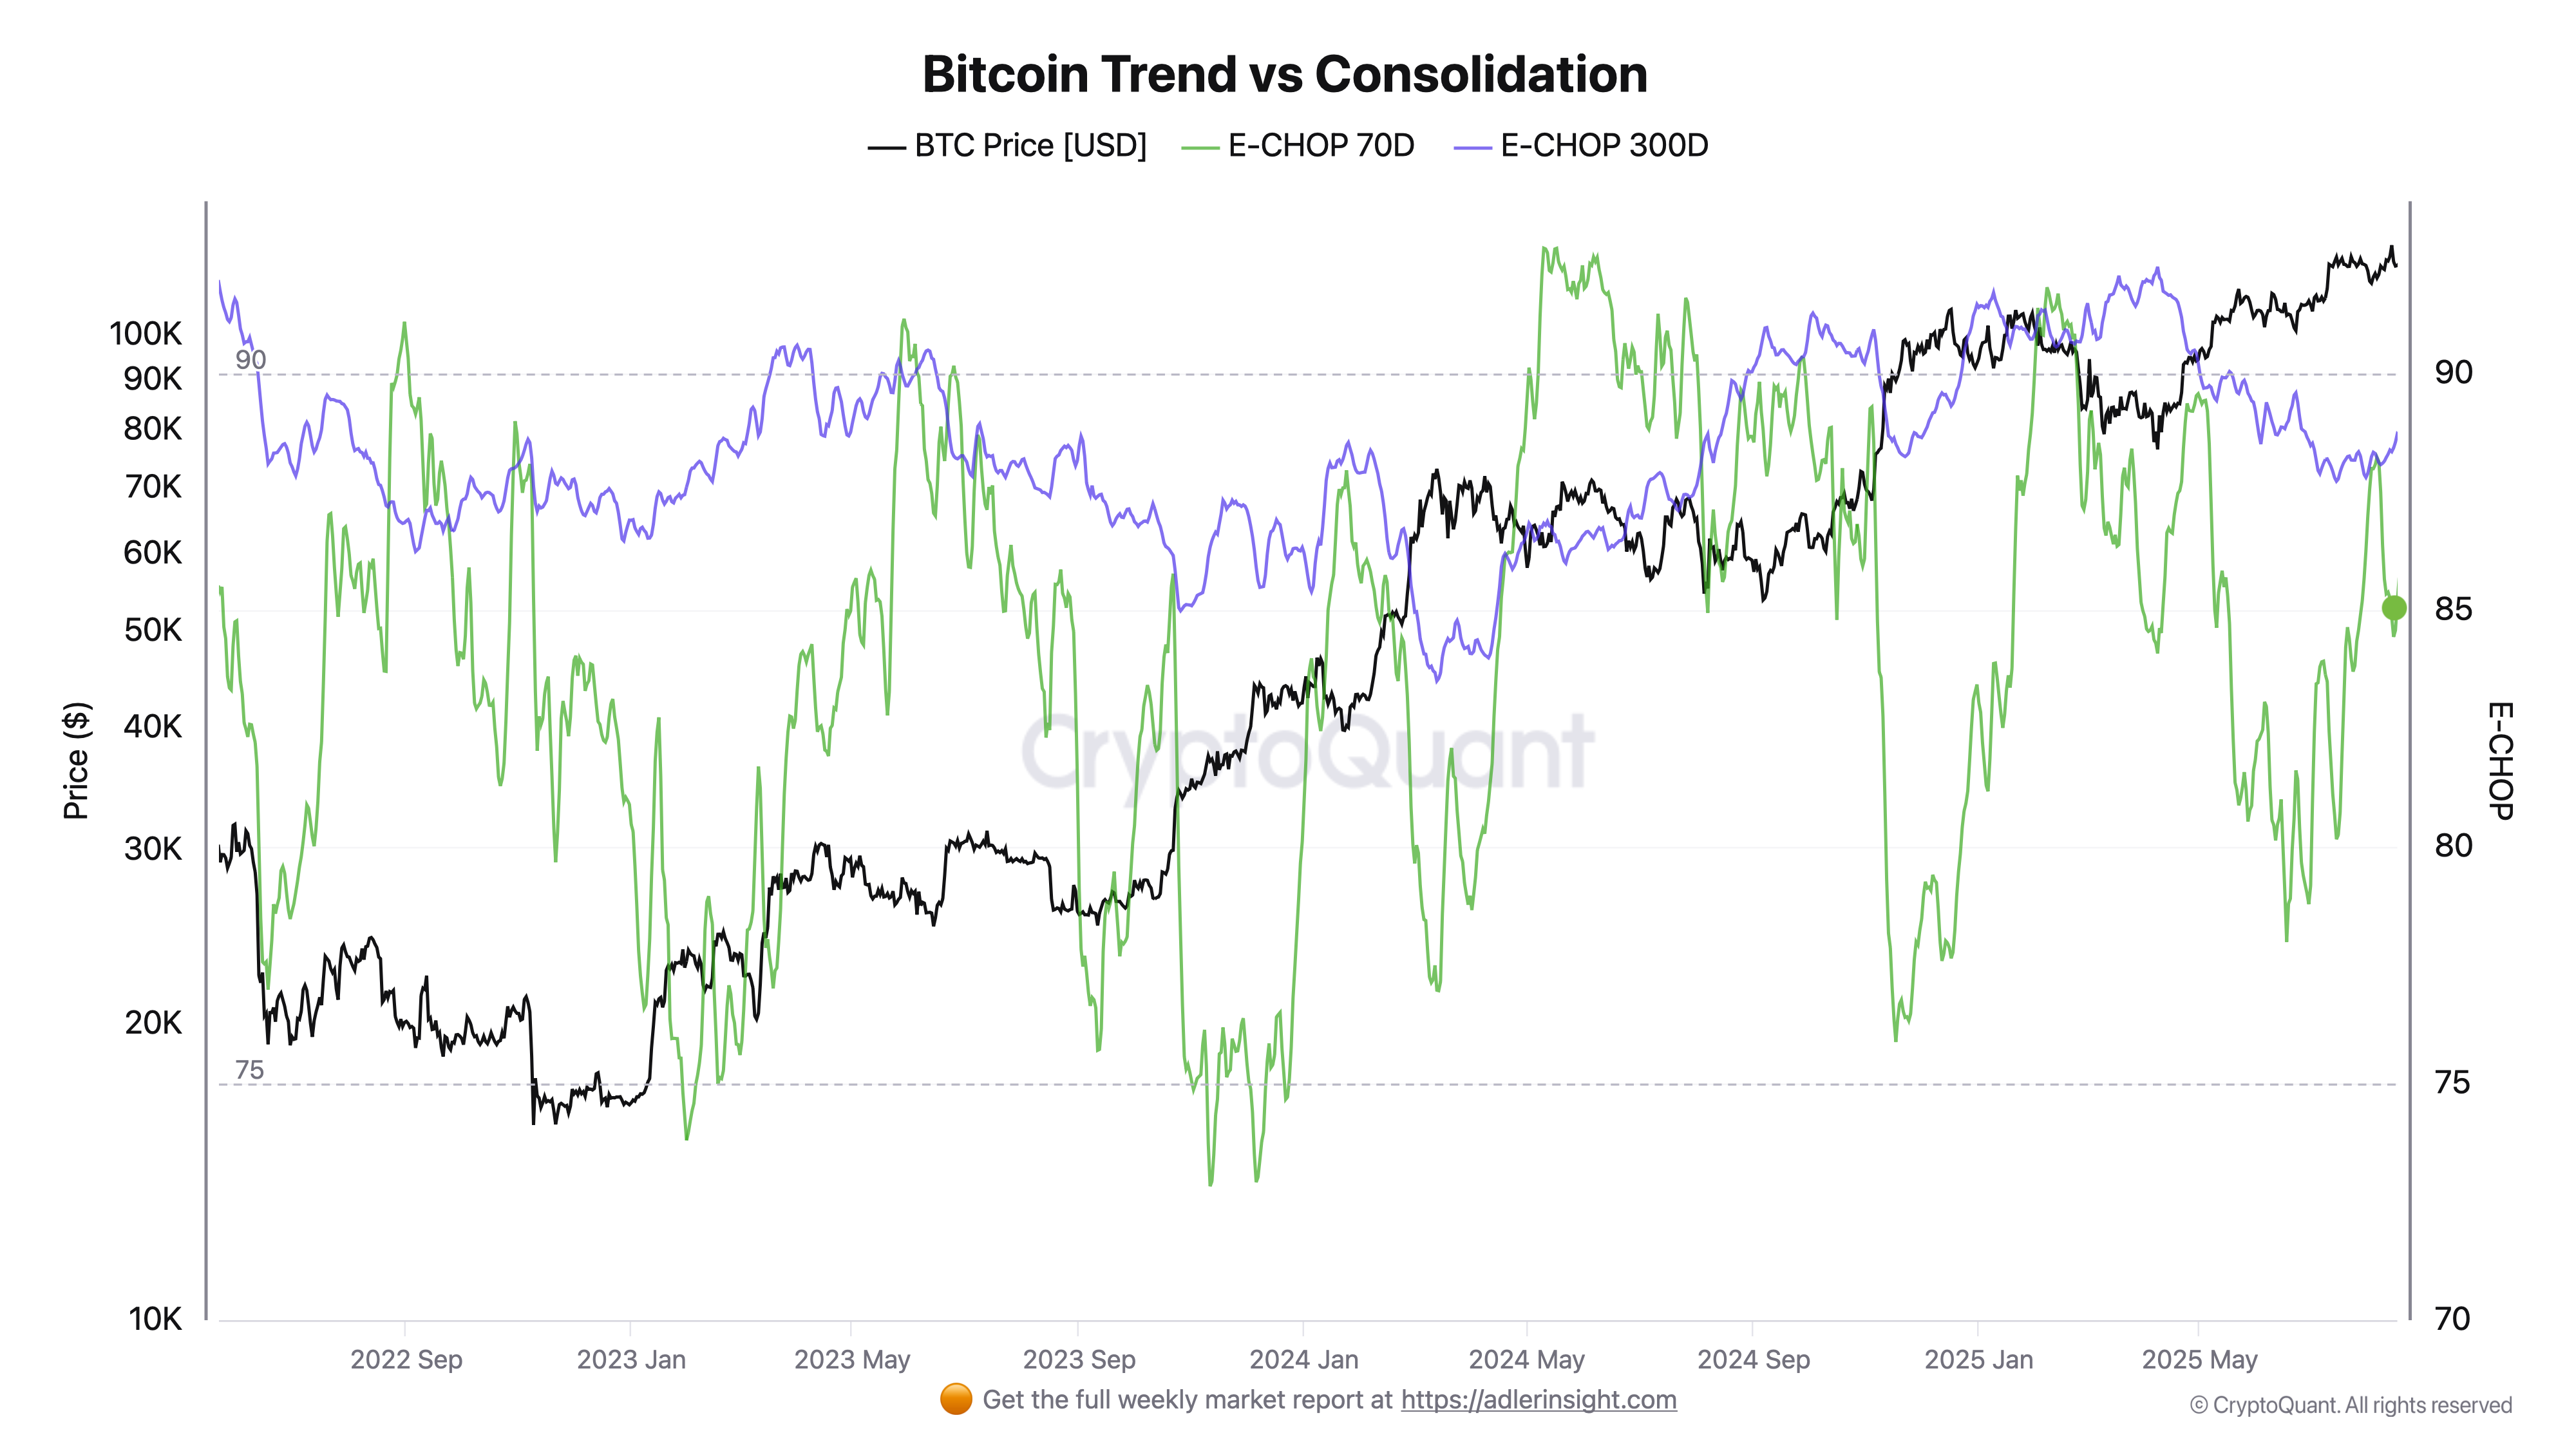
Over the past week BTC traded at ATH range upper boundaries without clear trend continuation. E-CHOP-70D (green) rose from 84 to 85, while E-CHOP-300D (purple) holds at 88. This combination indicates continued consolidation mode: impulse "distributed" across days and spikes up/down more often fade within range.
Conclusions. Base scenario - continued choppy action and boundary trading (sell spikes, buy dips). Sustainable trend will confirm if 70D closes below 80 and 70D–300D spread widens negative several sessions in row, strong signal - 70D drop below 75. Reverse risk signal - 70D return to >90 near historical highs: this is sign of renewed compression and increased probability of false breakouts both ways.

On-chain metrics
Bitcoin Daily Market Health Index (DMHI)
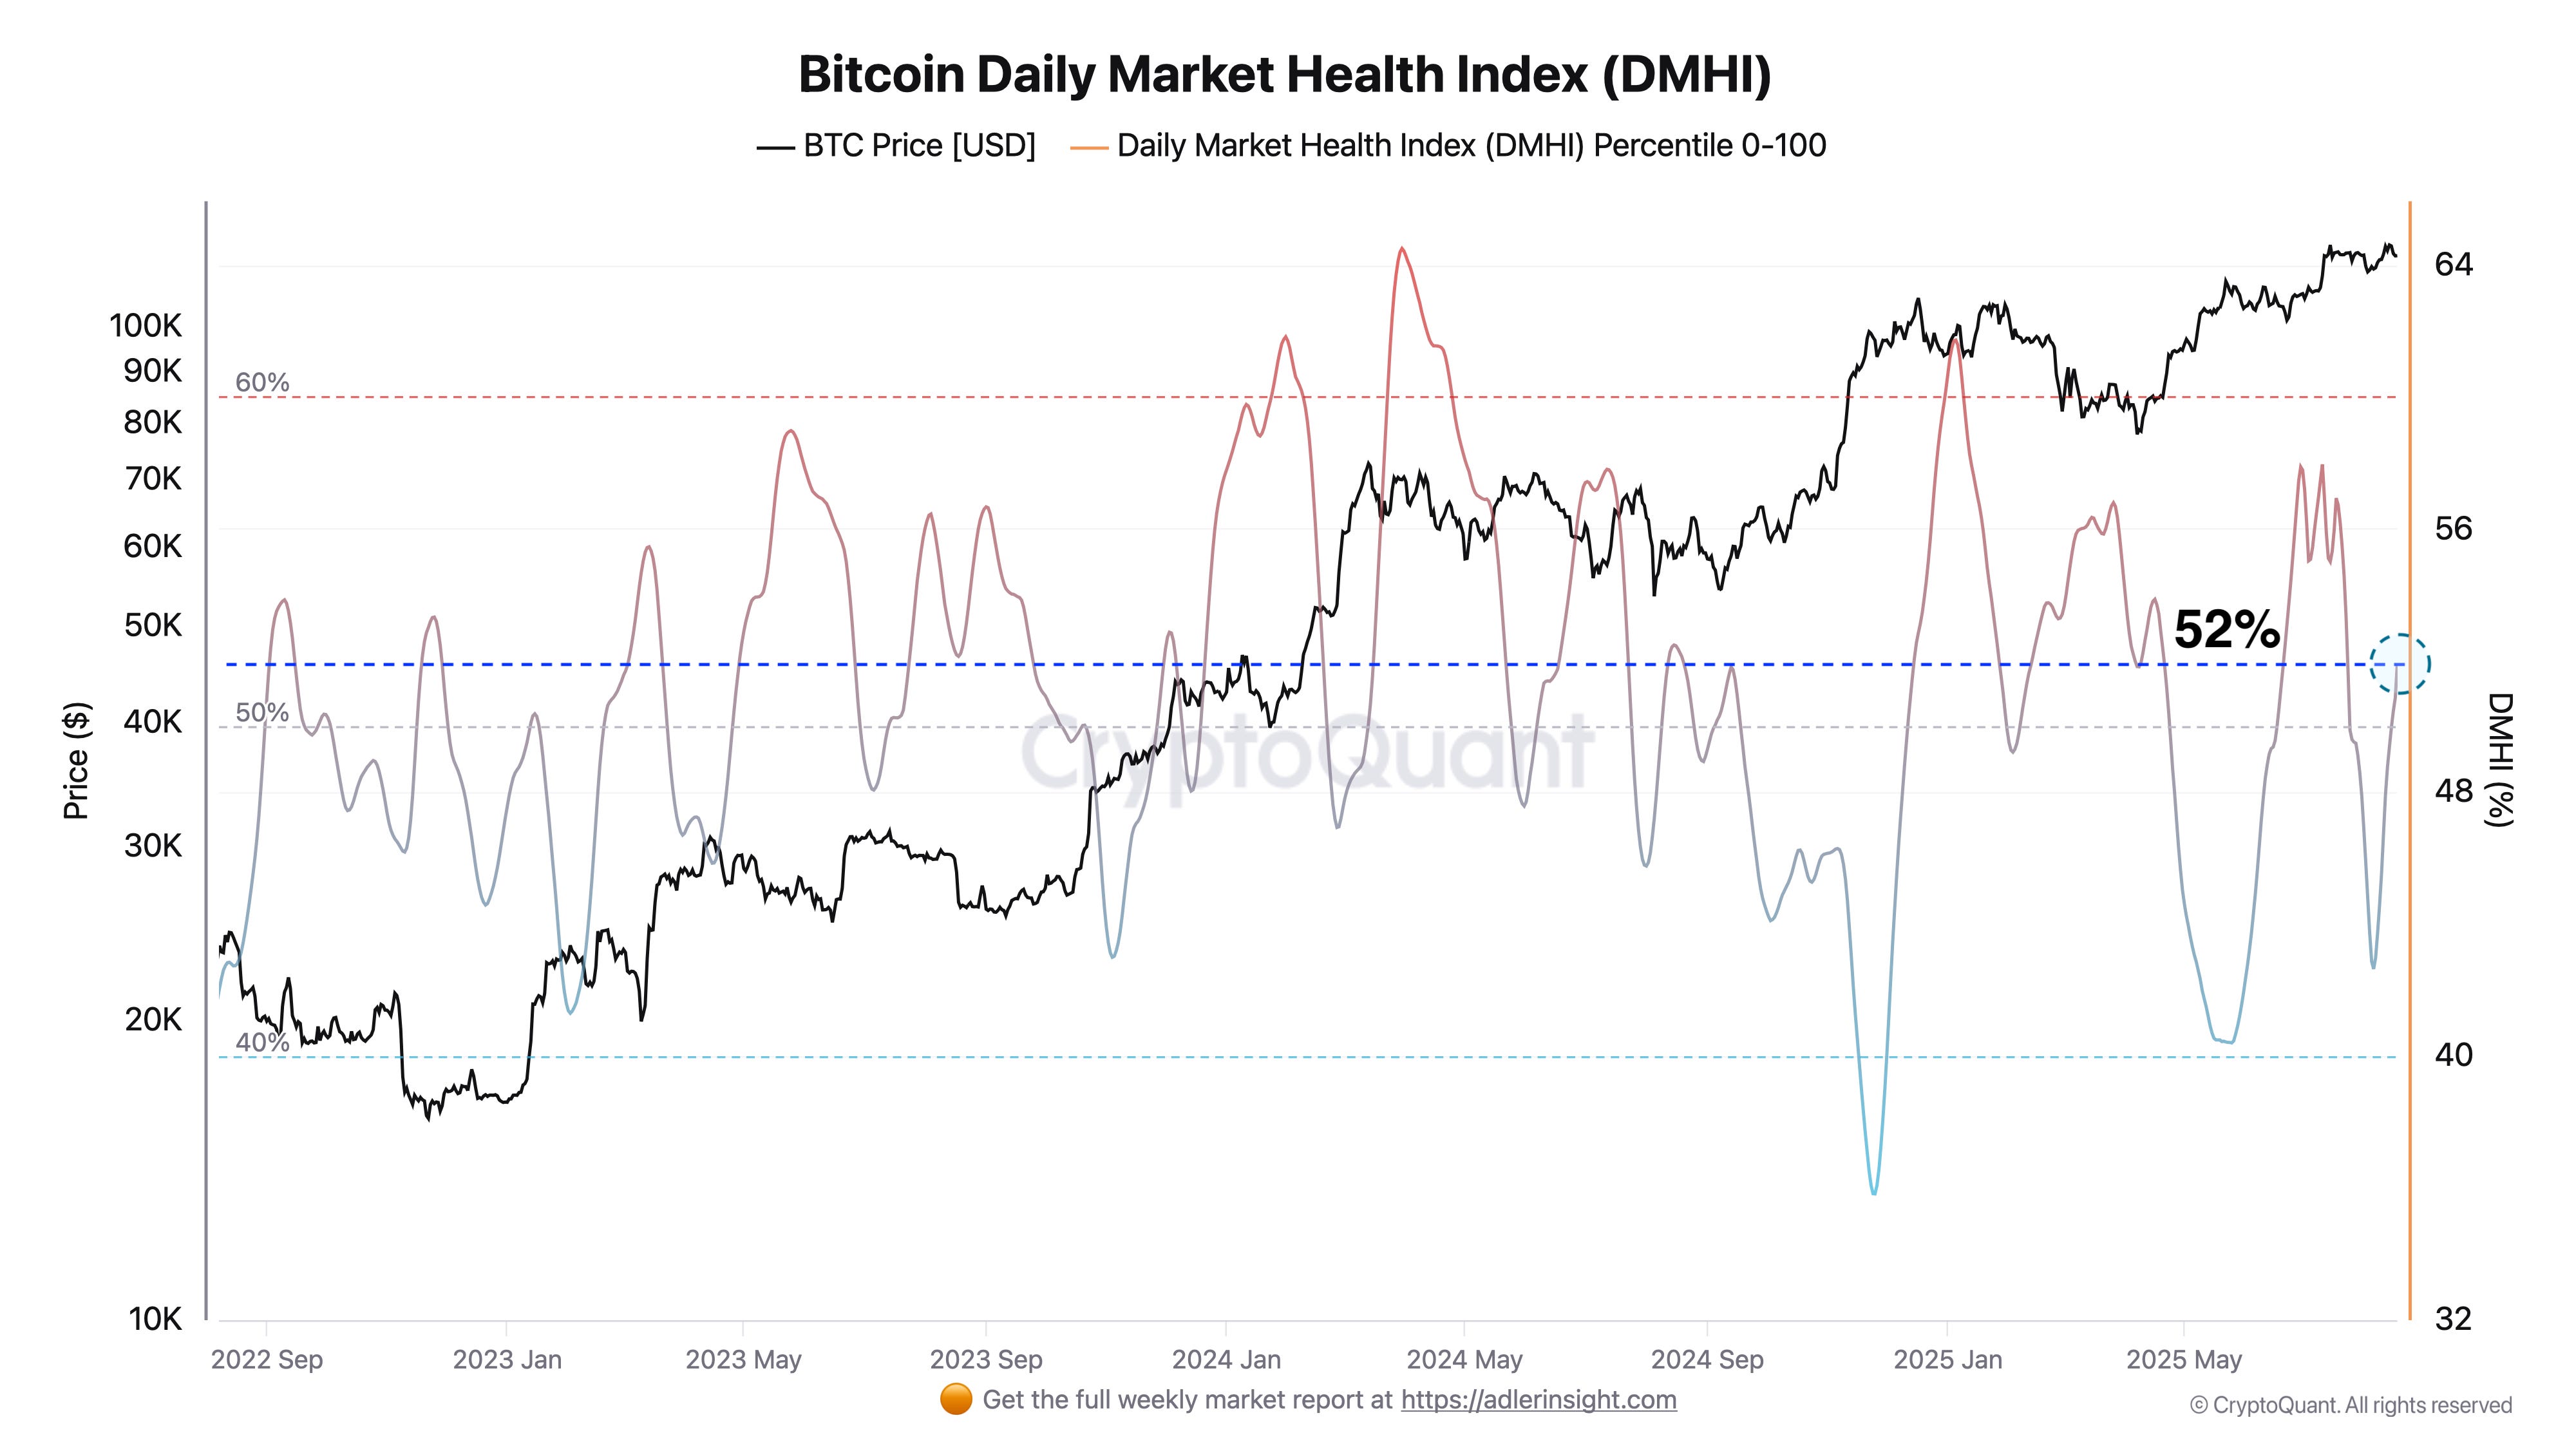
DMHI (Daily Market Health Index) - composite indicator of BTC market "health" on 0–100 scale. It combines four blocks: Profitability (LTH/STH SOPR), Valuation (MVRV with overheating inversion), Liquidity (exchange reserve dynamics) and Organic demand (realized cap growth relative to price growth). Each component normalized in 365-day window, inputs smoothed, and final composite logistically "compressed" to 0-100 range to avoid "choppiness" and preserve interpretability.
Higher DMHI means more sustainable fundamental backdrop for trend continuation (profitability >1, moderate valuation, exchange outflows, network capital growth not lagging price).
~50% - neutral-healthy; ≥60% - strong, "quality" market; ≤45% - growing vulnerability/correction probability.
DMHI index - not timing signal, but context: helps distinguish sustainable uptrend from overheated or fragile rally.
Current situation: $117K at DMHI 52% = "healthy-neutral". This is not overheating and not weakness - basic market structure supports trend, but "traction reserve" limited for now.
What this means:
50–55% on scale is balance: profitability moderately positive, valuation (MVRV, with inversion) without extremes, exchange outflows/"organic" inflows not dominating.
At ATH price this is rather for trend continuation than reversal, but rally remains vulnerable to normal 8–15% pullbacks.
What to watch next (regime change triggers):
Bull continuation: DMHI rises and closes >60% for 1–2 weeks with new price HH → usually leads to sustainable uptrend.
Reversal/deep pause risk: price updates ATH while DMHI doesn't make new high and drops <48–45% → bearish divergence, often precedes 10–25% corrections.
Bitcoin Risk-Off Signal Index
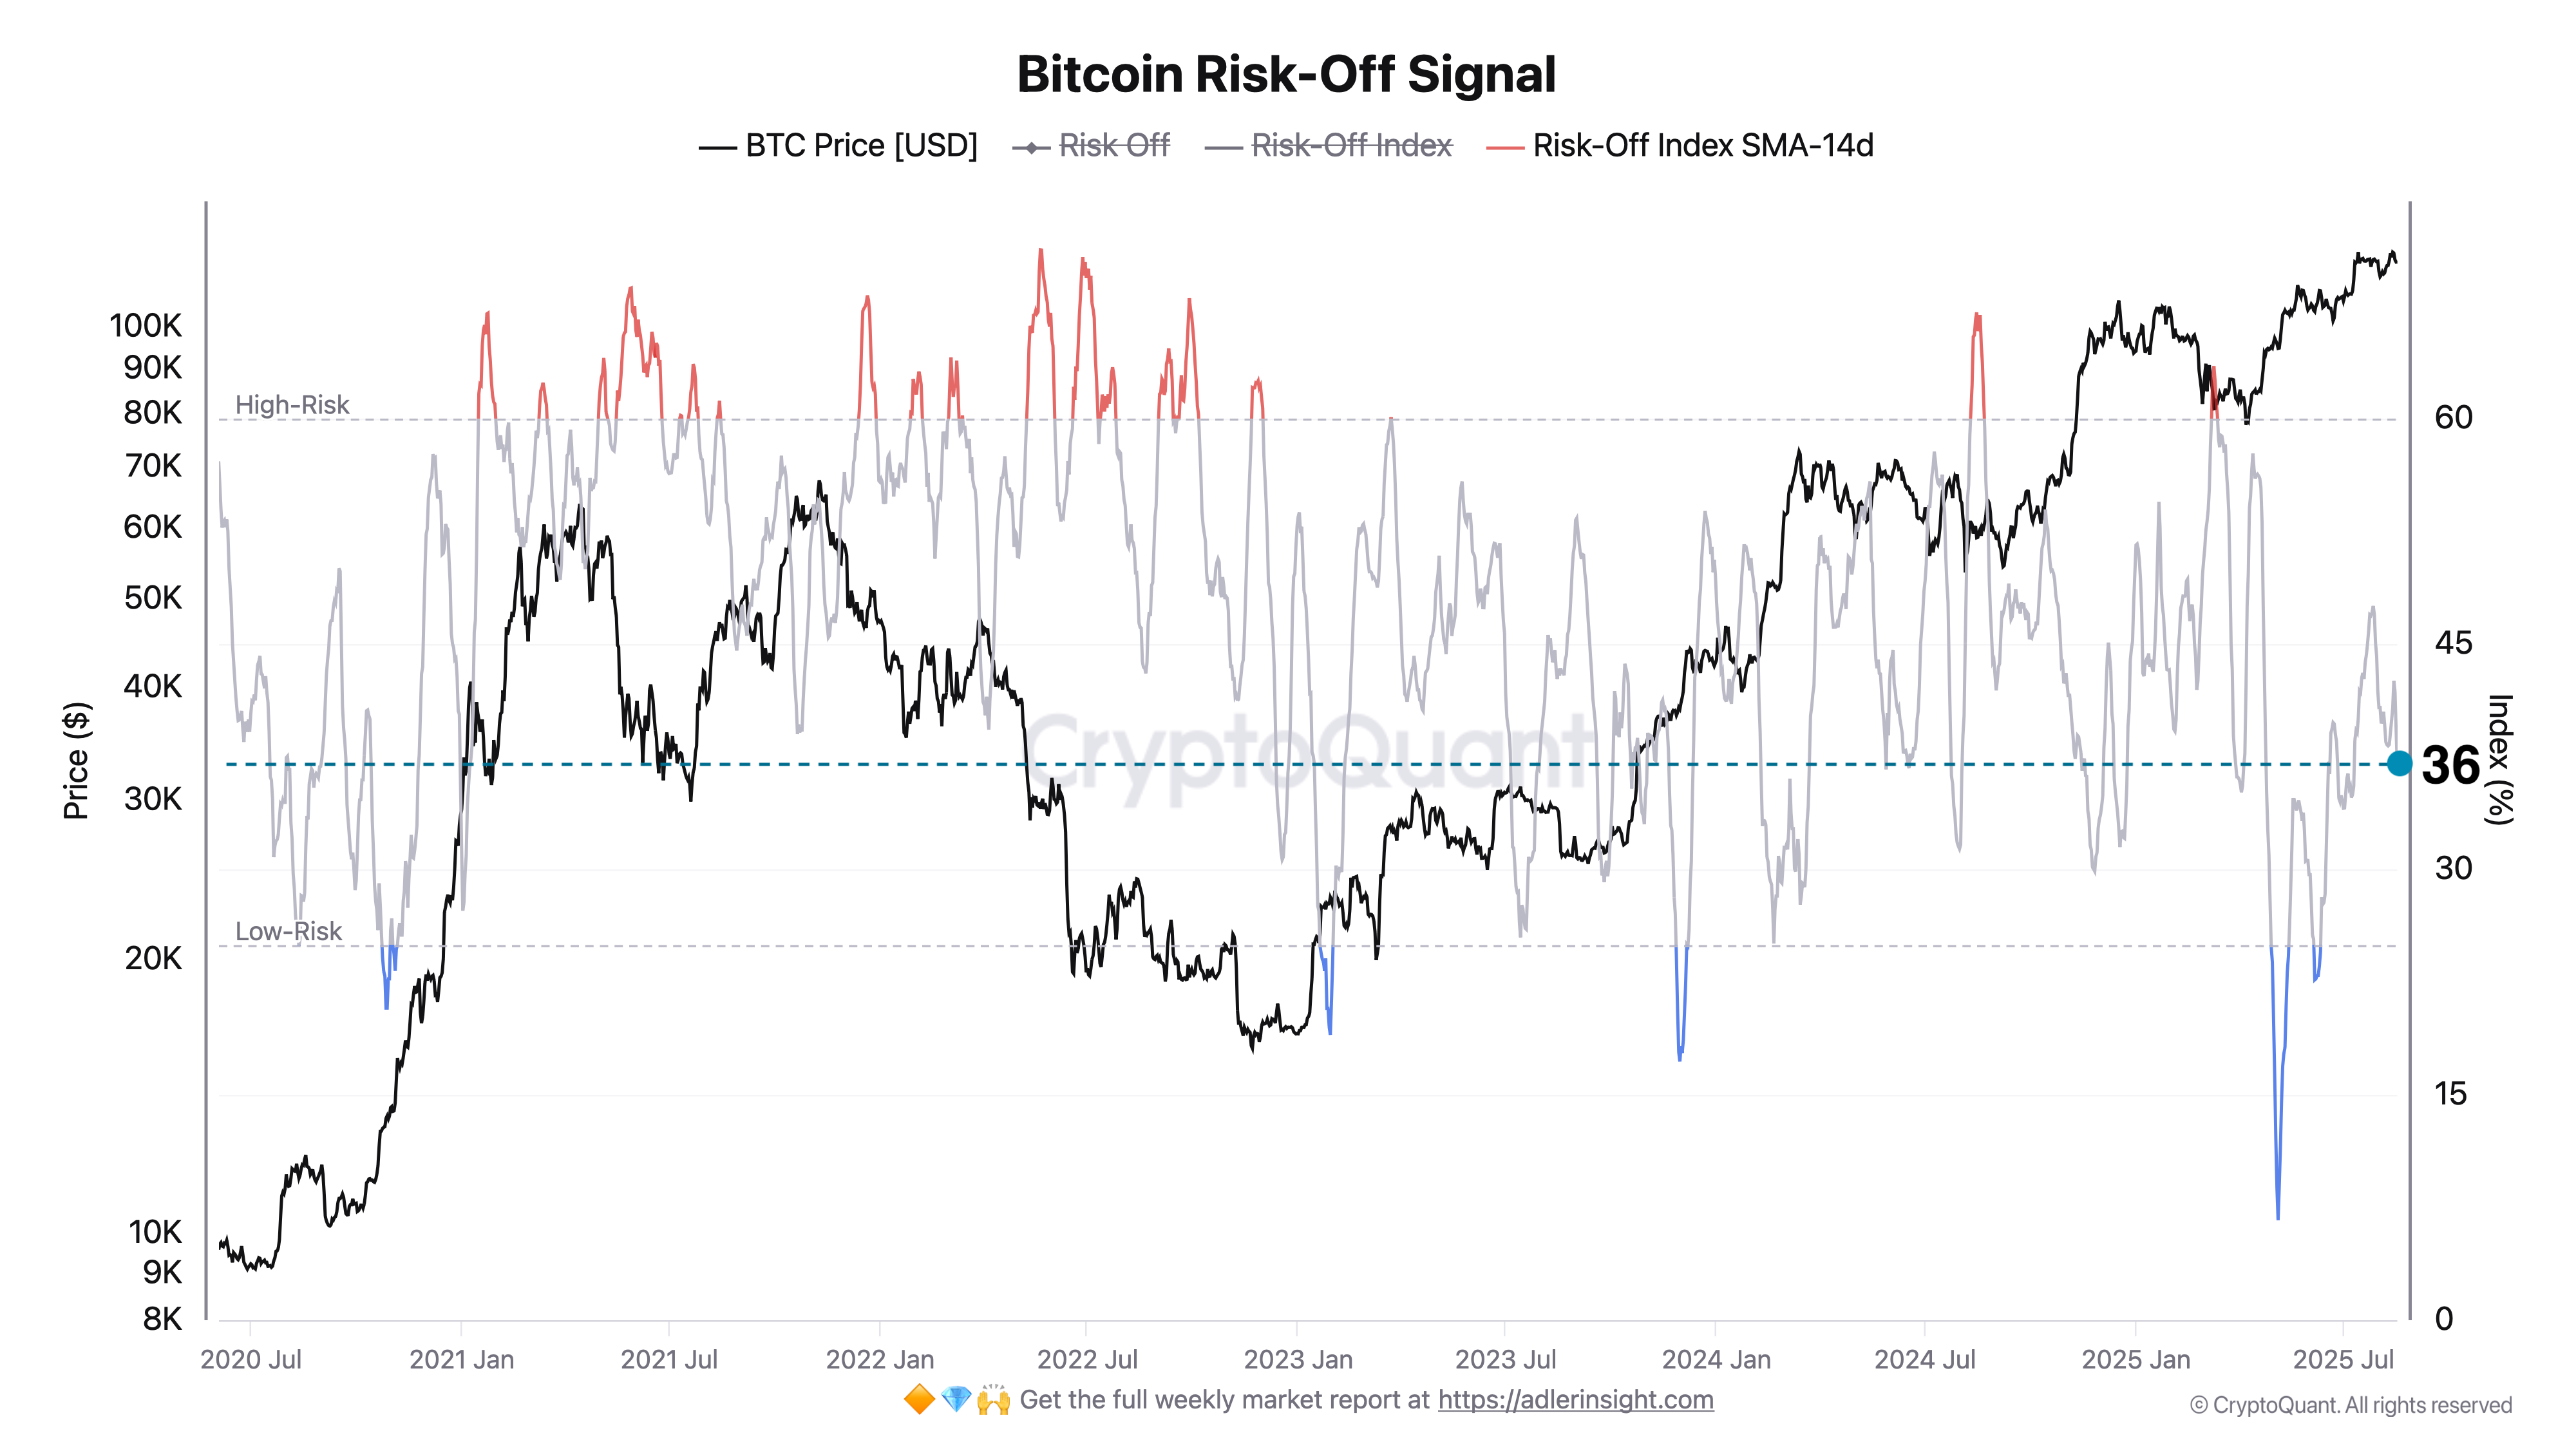
Bitcoin Risk-Off Index - composite "risk stress" indicator (0–100 scale), built from five blocks: 14-day downside volatility, net exchange inflows as supply share, 30-day funding z-score, open interest normalized to market cap and volatility asymmetry (downside − upside). Each component converted to percentile and aggregated with weights. Risk-Off Signal activates when final index >25, and SMA-14d smooths regimes.
Historically clusters >60 corresponded to distribution phases/local tops, while drops to low levels - periods of relief and more "safe" risk.
How to interpret levels.
<25 - low risk: pressure from derivatives/exchange flows weakening, trend continuation after relief more often observed.
25–60 - caution zone: market prone to "choppiness", range pullbacks and trend false starts.
>60 and rising SMA-14d - sustainable risk-off regime: increases probability of top formation/confirmation and deeper corrections.
Current picture.
Index = 36 - above activation threshold but far from extremes. This indicates moderately elevated caution: pressure from downside volatility/exchange flows felt, however "panic" risk-off regime not confirmed. Base scenario - consolidation with extended pullback risk within range, until indicator and its SMA-14d accelerate to >60. For bullish continuation would be positive to see return <25 over series of sessions and SMA-14d decline - then directional uptrend probability rises again.

Conclusion.
BTC finished week in tight ATH consolidation: 30D momentum slightly negative (−0.9%), E-CHOP maintains "choppy mode", and DMHI 52% signals "healthy-neutral" structure without overheating. On-chain - light exchange outflows (reserve decline), address activity drop and hashrate spike: price drivers come from exchanges/derivatives rather than network organic. Risk-Off = 36 - moderate caution without panic signs. Backdrop contradictory: dollar and yields weakened (risk support), but PPI jump and tariff risks limit growth, keeping markets in sideways corridor.
Outlook for coming week
Base scenario - range with pull toward "pin" around $120K at nearest expiration. Level guidance: support $117–116K, resistance $120–123K. Confident close above $123K on rising volumes opens move to $125–127K, loss of $116K raises decline risk to $115–112K. Week's key triggers - Powell speech at Jackson Hole, Fed minutes, PMI and housing data; from metrics important are "choppiness" easing and background market "health" improvement (for upside breakout), while risk-off regime growth - for extended sideways or correction.
Strategic backdrop - neutral-bullish bias with readiness for normal 8–15% pullbacks and accounting for continuing liquidity rotation into ETH.

Next week forecast
Market status: 🟢 OUTPERFORM (Accumulate)
This material is for research purposes and does not constitute investment advice.
More details about the rating can be found at this link:
https://adlerinsight.com/Adler_Insight_Rating.pdf
Good luck in the upcoming trading week!
AAJ
Disclaimer:
This material has been prepared solely for informational purposes and does not constitute an offer, recommendation, or solicitation to buy or sell any securities, digital assets, or other financial instruments. The information presented in this report is considered reliable; however, its accuracy or completeness is not guaranteed. Past performance is not indicative of future results. Any investment decisions are made by the investor independently, taking into account personal financial circumstances and, if necessary, after consultation with a qualified professional. The author and affiliated parties may hold positions in the assets mentioned in this report. The author and publisher accept no responsibility for any direct or indirect losses arising from the use of this information.
Risks:
High volatility may lead to sharp fluctuations in value, adversely affecting investors' portfolios. Significant price swings may reduce the attractiveness of BTC to institutional investors, especially in the derivatives segment (futures, options). Potential tightening of regulatory requirements by governments and central banks may restrict access to BTC markets and reduce liquidity. Issues with custodial services, centralized exchanges, and hacking incidents could undermine confidence in the asset and negatively impact liquidity.
BITFORM | Forecast Accuracy Ranking — Bitcoin Week of Aug 11–17, 2025
What this is
The Decoder Review is not just a self-audit of BITFORM. To be meaningful, accuracy must be placed in context. That’s why every week we compare BITFORM’s structural forecasts with other major voices — institutional research desks, Substack analysts, on-chain specialists, and media narratives.
The methodology is simple:
Scored 1–10 based on alignment with market reality
Evaluated on levels, triggers, flows, and scenarios
Only forecasts published before or during the week are included
Market Reality Recap
BTC opened near $121.7K, tested $124.2K on Aug 14 after CPI, then slid back to close ~$117–118K.
Range extremes: $116.9K low ↔ $124.2K high.
ETF inflows net +$1.05B but concentrated in IBIT.
Macro soft CPI gave risk-on impulse; rally faded into re-range.
🎯 Forecast Accuracy Ranking
1. Bitcoin Vector Lite (Willy Woo) — 8.8 / 10
Saw speculative rallies through short squeezes as the dominant mechanism.
Called microstructural fragility accurately, especially around $124K.
Weakness: less breadth/macro integration.
2. BITFORM (Florian Jumel) — 8.6 / 10
Defined clear scenario fork: CPI → break >$118.5K on inflows vs <$116K on outflows.
Delivered trigger discipline: no sustained breakout without breadth & persistence.
Edge: False-break shield at $125K preserved capital.
Weakness: Breadth codification not yet fully hardwired.
3. Glassnode — Market Pulse — 8.5 / 10
Strong on on-chain caution: profit levels high, volumes weak.
Correctly doubted durability of the breakout.
Weakness: Fewer actionable levels, more descriptive than executable.
3. K33 Research — Ahead of the Curve — 8.5 / 10
Precise structural ranges: $122K retest → $117K gap fill.
Delivered the week almost point-for-point.
Weakness: Lacked conditional triggers and flow gating.
4. Bitcoin News Digest (Mike Richardson) — 8.6 / 10
Highlighted key resistance levels and ATH retest potential.
Caught the push into $123–124K.
Weakness: Less emphasis on ETF breadth; more static than dynamic.
5. ecoinometrics — 8.4 / 10
Captured ETF inflow recovery narrative.
Weakness: No structural scenarios or trigger mapping; analysis more thematic.
6. Adler’s Insights (Axel Adler Jr.) — 8.0 / 10
Framed the $118K compression zone well.
Weakness: Missing flow conditions, no multi-scenario compass.
7. Kaiko Research — 8.2 / 10
Correct macro rationale (Fed cut pricing, softer USD).
Weakness: Overweighted rebound narrative; no re-range bias.
8. Mitrade Weekly Forecast — 8.2 / 10
Predicted: spike → unwind to ~$118.8K.
Accurate shape, but published after CPI → reactive timing.
9. Bitfinex Alpha — 8.0 / 10
Warned breakout durability was questionable.
Weakness: lacked full scenario set; intuition over structure.
10. Media Layers
Cointelegraph (7.8 / 10): flagged CPI & $117K gap, lacked precision.
CoinDesk (7.5 / 10): CPI fork, over-weighted downside hedge.
Barron’s (7.5 / 10): bullish macro tailwinds, upside targets missed.
Zerocap (7.2 / 10): thematic, not tactical.
🧭 Decoder Verdict
Upper Quartile: BITFORM (8.6), Glassnode/K33 (8.5), Willy Woo (8.8).
Second Tier: Richardson (8.6), ecoinometrics (8.4), Adler (8.0), Kaiko/Mitrade (8.2).
Lagging: Bitfinex Alpha (8.0 but less structured), media (7.2–7.8).
Forecast accuracy isn’t about being right, it’s about defining risk with precision.
The false-break at $124K–125K was the test.
Most narratives leaned bullish, but without hard flow gates.
BITFORM’s discipline meant no chase, no trap.
The upgrade path is clear:
Codify ETF breadth and persistence rules
Refine time-decay resets
Keep scenario forks event-driven, not opinion-driven