


Bitcoin Trends – W3 May 2025
ETF inflows and corporate purchases are pumping Bitcoin, while on-chain data allows for a new momentum formation.

TL;DR:
Deteriorating macro fundamentals in the US and global tariff chaos intensify "risk-off" sentiment, but capital inflows into Bitcoin ETFs, sovereign and corporate purchases, as well as gradual reduction in BTC exchange reserves support the price above $100K. On-chain indicators show warm but still controlled heating, leaving upside potential to the critical overheating zone.

Macroeconomics Last Week
Priority: High
University of Michigan Consumer Sentiment Index fell to 50.8 in May

The preliminary estimate showed a decline from 52.2 in April to 50.8, significantly below expectations of 53.4. This is the fifth consecutive monthly decline, the lowest reading since June 2022 and the second lowest in history. The current conditions index fell to 57.6 (from 59.8), while the expectations index dropped to 46.5 (from 47.3). Personal finance assessments fell nearly 10% due to reduced income, while tariff mentions rose to 75% of respondents (vs. 60% in April). One-year inflation expectations rose to 7.3% (highest since 1981), and long-term expectations increased to 4.6% (from 4.4%).
Moody's downgraded the US long-term rating from AAA to AA1 and changed outlook to "stable"
Rating agency Moody's lowered the long-term issuer rating and unsecured debt rating of the US government from the maximum AAA to AA1, changing the negative outlook to stable. The decision reflects rising fiscal risks and political uncertainty, which may increase borrowing costs and heighten volatility in financial markets.
Priority: Moderate
US building permits in April fell 4.7% to 1.412 million units
The seasonally adjusted annual rate of permits declined from 1.481 million in March to 1.412 million - an 11-month low and below the forecast of 1.45 million. Single-family permits fell 5.1% to 922 thousand (nearly a two-year low), while multi-family dropped 4.4% to 431 thousand. By region: Midwest -8.1% (to 192k), South -9.6% (to 754k), Northeast +14.3% (to 136k), West +3.4% (to 330k).US import prices in April rose 0.1%
Monthly change in import prices showed a 0.1% increase against expected -0.4% decline, despite imposed 10% tariffs. Annual growth was 0.1%. The main contributor to growth was non-energy imports (+0.4% y/y) due to higher prices for capital goods, non-energy industrial materials, consumer goods, and automobiles. Fuel import costs decreased 2.6% (second consecutive decline).
Priority: Low
Eurozone trade surplus grew to record €36.8 billion in March
The surplus increased from €22.8 billion a year earlier thanks to 13.6% export growth to €279.8 billion. Imports rose 8.8% to €243 billion. For the entire EU, the surplus expanded to €35.3 billion, exports to €254.8 billion (+15.2%), led by chemicals (+55%), machinery and transport equipment (+6.5%), food and beverages (+5.6%). Exports to the US grew 59.5%, to Switzerland 26.3%, to the UK 4.8%. EU imports increased 10.4% to €219.5 billion, mainly from China (+15.8%), US (+9.4%) and UK (+5.4%).
Short-term combination of weak consumer confidence, US credit rating downgrade and reduced construction activity intensifies risk-off in US stocks and credit securities. Import prices do not yet confirm sustained inflation, but tariff uncertainty raises risk premium.
For alternative assets like Bitcoin deteriorating US credit quality and search for insurance against fiscal risks creates countervailing demand flow, especially amid continuing ETF inflows into BTC.
European exporters may temporarily benefit from strong surplus, but echoes of tariff war and possible euro strengthening limit potential.Thus, the overall vector remains moderately "risk-off", but within the risk asset class shifts toward defensive and "pseudo-defensive" stories, while high-beta and cyclical parts of the US stock market look most vulnerable.

Stock Market Last Week
Priority: High

Friday Results:
S&P 500 +0.7%, Nasdaq 100 +0.4%, Dow Jones +331 pts
Conclusion: Fifth consecutive daily gain on the back of a 90-day tariff truce between US and China.
Trade delay vs weak consumer sentiment:
90-day tariff truce boosted market optimism.
Michigan Consumer Confidence Index fell to 50.8 (second historical low), while inflation expectations rose to 7.3%.
Conclusion: Strong positive from trade "truce" was tempered by deteriorating consumer sentiment and rising inflation expectations.
Weekly Results
S&P 500 +5.3%, Nasdaq 100 +7%, Dow Jones +3.4%.
Technology stocks led gains: Nvidia +16%, Meta +8%, Apple +6%, Microsoft +3%.
Market remains positive but maintains attention on further details of US-China trade negotiations.

Important News from Past Week
Priority: High
Fidelity predicts new Bitcoin all-time high by end of Q2, citing strong market dynamics and continued global cryptocurrency adoption.
Abu Dhabi sovereign wealth fund invested $408 million in BlackRock Bitcoin ETF, increasing its ETF holdings to nearly $1 billion.
Twenty One Capital (backed by Tether) bought 4,812 BTC for $458.7 million, bringing its bitcoin reserves to over $4 billion and taking third place among public companies by holding volume.
Nakamoto together with KindlyMD launched Bitcoin Treasury project, raising $710 million, which became the largest public capital raise in the crypto industry.
Coinbase shares rose 8% after inclusion in S&P 500 index, becoming the first company specializing exclusively in cryptocurrencies in this leading stock index.
Priority: Moderate
Binance and Kraken repelled phishing attacks similar to Coinbase hack without data loss thanks to triggered internal protective measures.
Wisconsin state sold $321 million in BlackRock Bitcoin ETF shares but retained $19 million in Coinbase stock, changing investment risk profile in crypto sector.
JPMorgan expects greater Bitcoin growth potential compared to gold in H2 2025, noting active corporate purchases and strengthening government adoption.
FTX will begin creditor payouts of $5 billion through BitGo and Kraken from May 30, returning funds to users based on valuations as of 2022.
eToro shares jumped 29% after Nasdaq debut, closing at $67 vs IPO price of $52 thanks to high investor demand.
Priority: Low
Metaplanet acquired 1,241 BTC for $126.7 million, increasing reserves to 6,796 BTC - surpassing El Salvador's national reserves.
Brazilian company Méliuz acquired 274.5 BTC for $28.4 million, becoming the first company in the country to execute cryptocurrency treasury securities operations on exchange amid rising corporate adoption of digital assets.
Conclusions
Today we observe a rare combination: (1) large institutional purchases, (2) expansion of public platforms for crypto companies, (3) improvement in market infrastructure quality. All this creates a "multi-factor bullish wind," increasing the probability of testing a new ATH within Fidelity's stated timeframe and raising the minimum acceptable valuation for strategic investors.

Bitcoin Trading Week Macro Analysis
1. BTC/USD Pair Analysis
Key Weekly Indicators
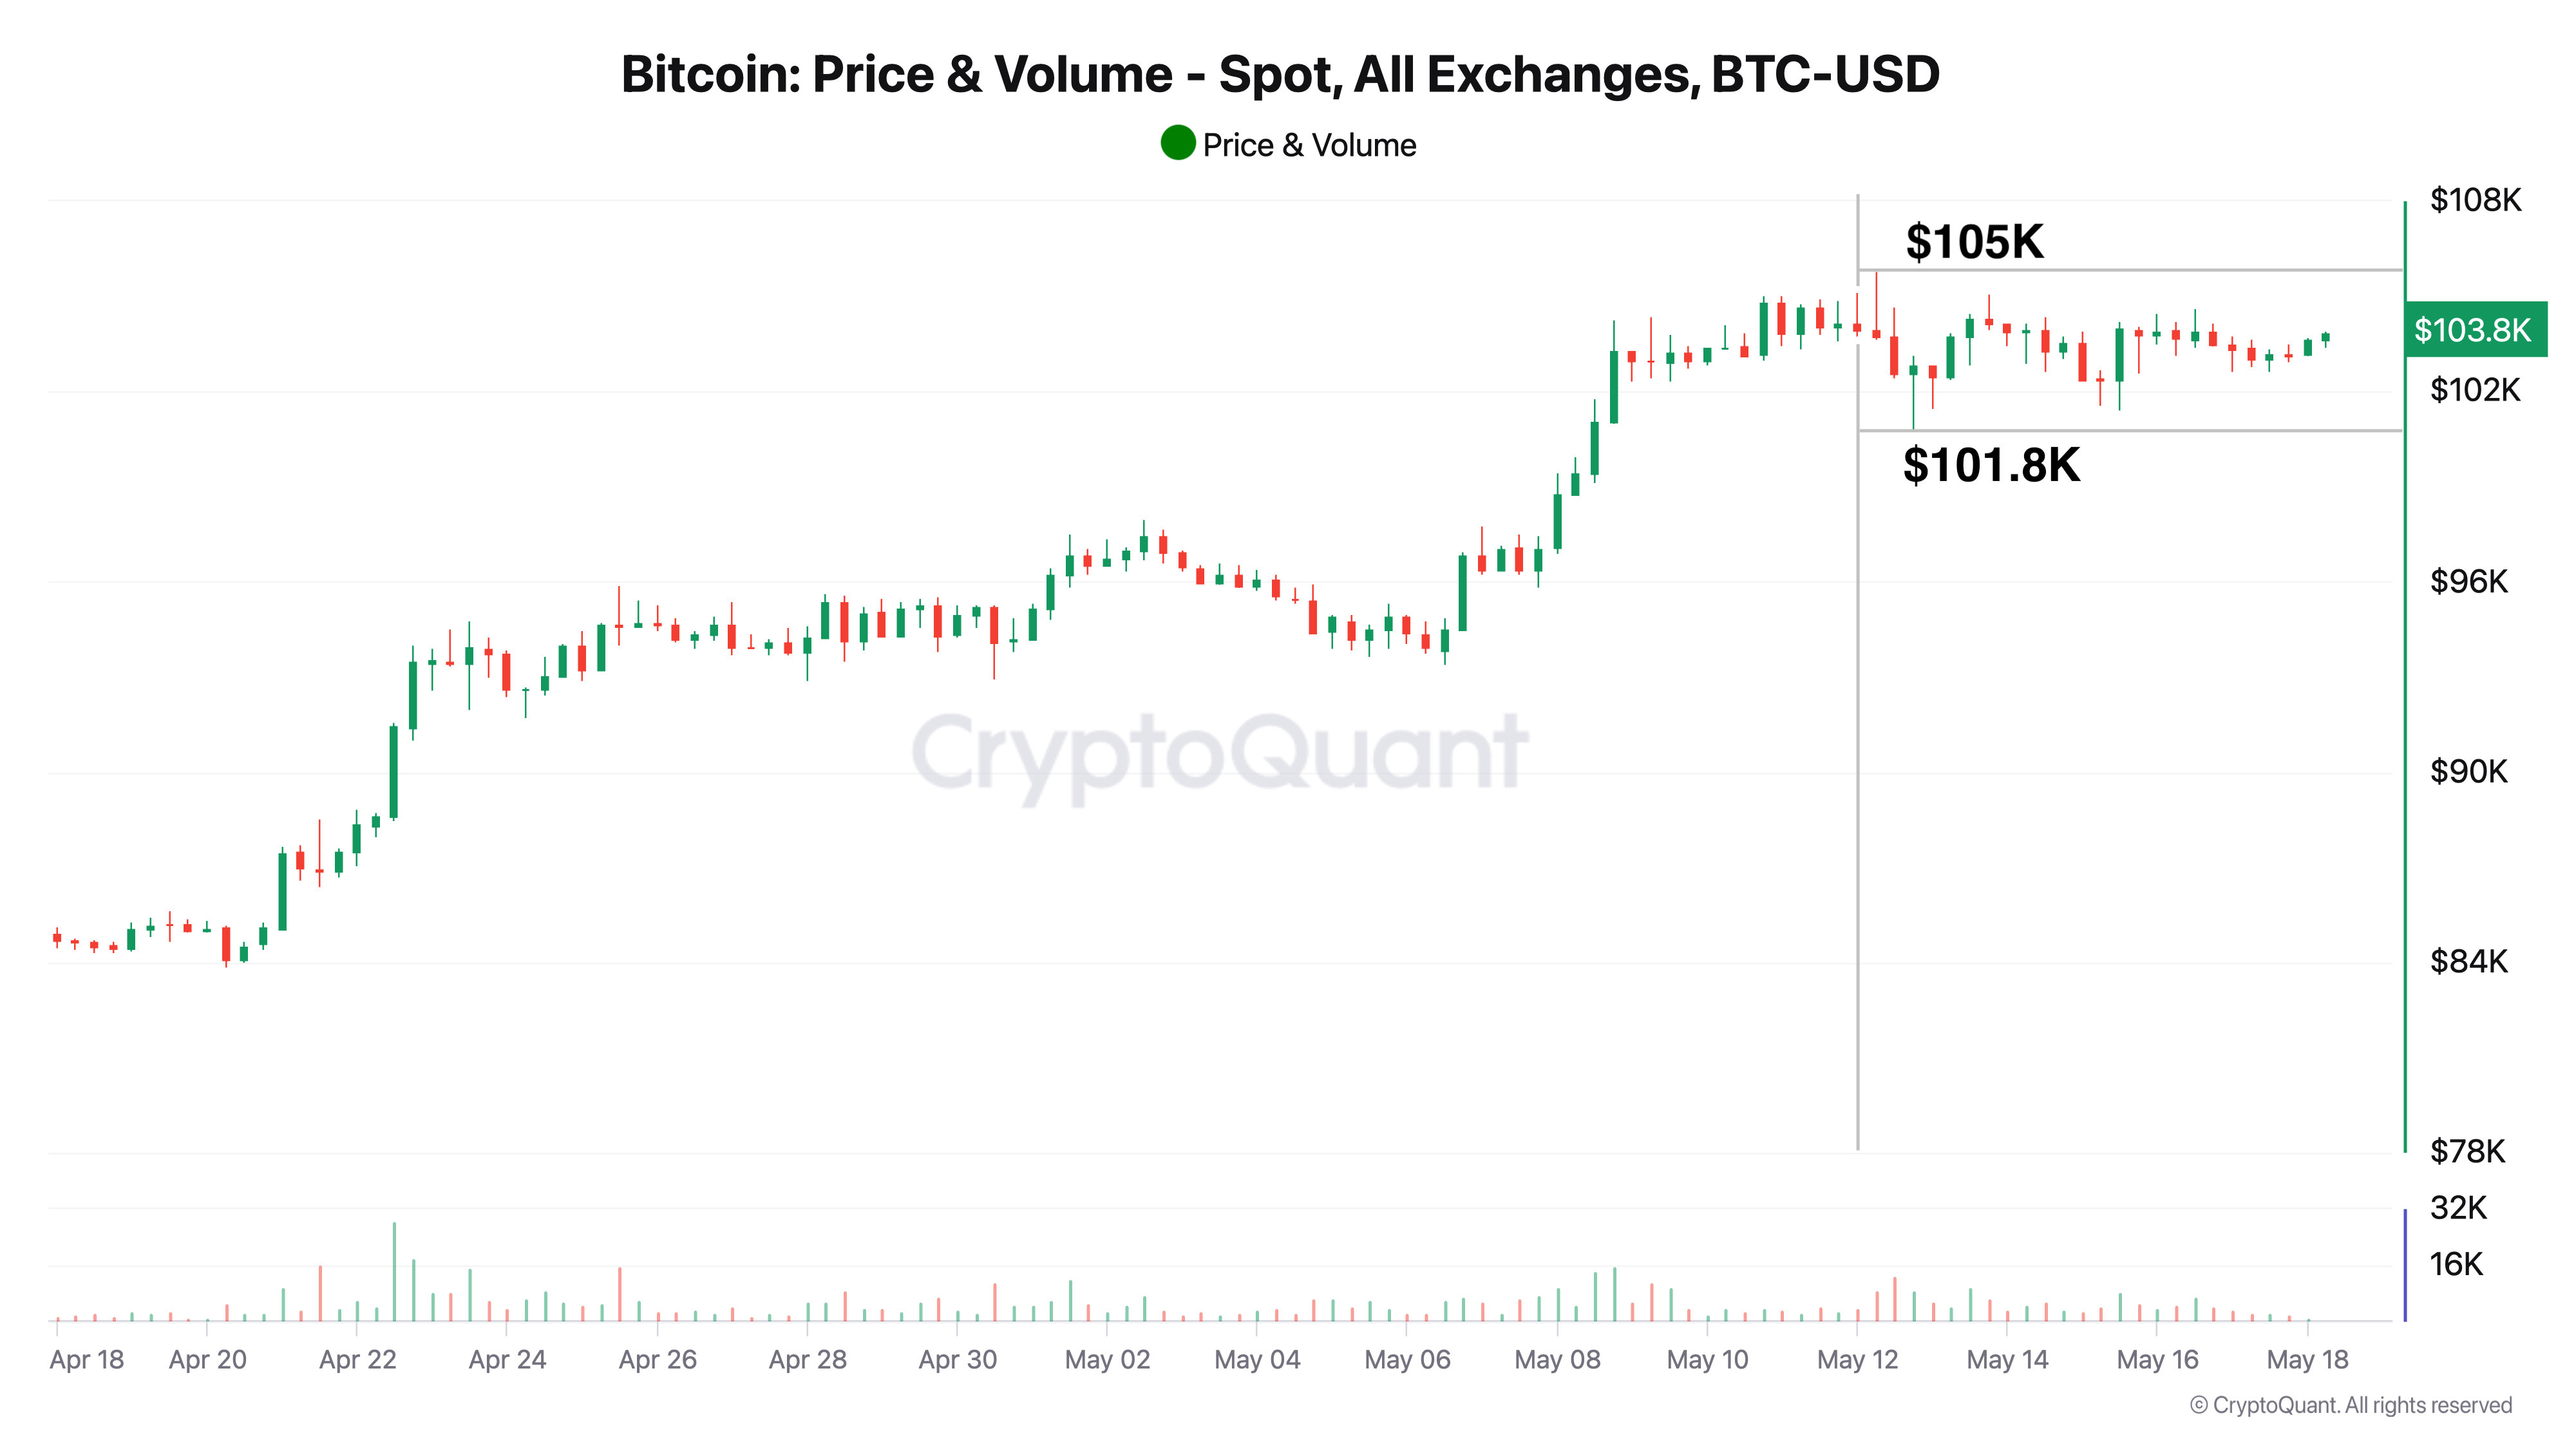
Current Price: ≈ $103.8K
Local High: $105K
Local Low: $101.8K
Trend
This week Bitcoin entered a stage of "narrow consolidation" after last week's impulse. Volumes noticeably contracted, and price weakly oscillates within the $101.8K – $105K corridor. Several attempts to break resistance at $105K ended in failure - this indicates position accumulation and demand testing before the next movement phase.
Conclusions
Key Resistance: $105K
Breakout above on increased volumes could open path to new rally toward $110KLocal Support: $102K
Holding this zone will preserve bulls' advantage and minimize risk of sudden decline.Strong Base Support: $100K
Break below psychological $100K level will intensify seller pressure and may lead to deeper correction.
2. Options Analysis

Market Structure
Call Options Predominance:
Green bars concentrated on $105K –$115K strikes, with volume peaks at $115K (≈8M) and $112.5K (≈6M). This indicates active hedging for growth above current Max Pain.Put Options:
Red bars dominate on $75K –$90K strikes, with maximum interest on $75K (≈10M) and $77.5K (≈8M) range. Put volumes on strikes above $90K continue declining, indicating downward shift in protective bets.
Comparative Analysis vs Previous Week
Max Pain Change:
Max Pain level rose from $100K to $102K, reflecting further shift in interest balance toward higher prices.Volume Dynamics:
Call volumes on $112.5K – $115K strikes increased compared to last week, while Put volumes in $82.5K–$90K zone continued declining. However, the largest Put bar remains at $75K–$77.5K level.
Forecast
Possible Growth:
Holding support at $102K and further Call volume building may lead to testing $104K–$106K zone, and with confident breakout - to $110K.Correction Risks:
Breaking support at $102K with simultaneous Put volume growth could return price to $100K–$101.5K range, where main bear protection is concentrated.

Bitcoin Network Data Analysis

1. Network Hashrate:
Previous Week: 888,195,184,226 EH/s
This Week: 864,817,437,876 EH/s
Change: 🔴 −2.63%
Comment: Moderate hashrate decline may be caused by mining capacity optimization. This temporarily reduces network security but doesn't threaten its stability.
2. Market Capitalization:
Previous Week: $2,081,491,584,645
This Week: $2,049,167,408,787
Change: 🔴 −1.55%
Comment: Small capitalization decline reflects asset redistribution despite overall bullish market sentiment.
3. BTC Exchange Reserves:
Previous Week: 2,457,252 BTC
This Week: 2,435,318 BTC
Change: 🔴 −0.89%
Comment: Continued outflow of coins from exchanges indicates long-term accumulation and reduced potential supply pressure.
4. Transfer Volume (7d):
Previous Week: 4,824,894 BTC
This Week: 4,381,983 BTC
Change: 🔴 −9.18%
Comment: Significant decline in transfer volumes related to reduced short-term speculative activity.
5. Number of Active Wallets (7d):
Previous Week: 9,488,286
This Week: 7,796,424
Change: 🔴 −17.83%
Comment: Significant drop in number of active addresses indicates consolidation and reduced speculative operations despite price growth.
6. Market Price:
Previous Week: $96,847.38
This Week: $103,740.59
Change: 🟢 +7.12%
Comment: Price growth reflects renewed demand and investor optimism amid accumulation at lower levels.
Conclusions:
Moderate hashrate decline: may be caused by technical maintenance or capacity optimization and poses no threat to the network.
Long-term accumulation continues: BTC outflow from exchanges and declining transfer volumes reduce potential supply pressure.
User activity reduction: sharp drop in number of active wallets indicates consolidation and reduction in short-term speculative activity.

On-Chain Metrics
Bitcoin Advanced Net UTXO Supply Ratio
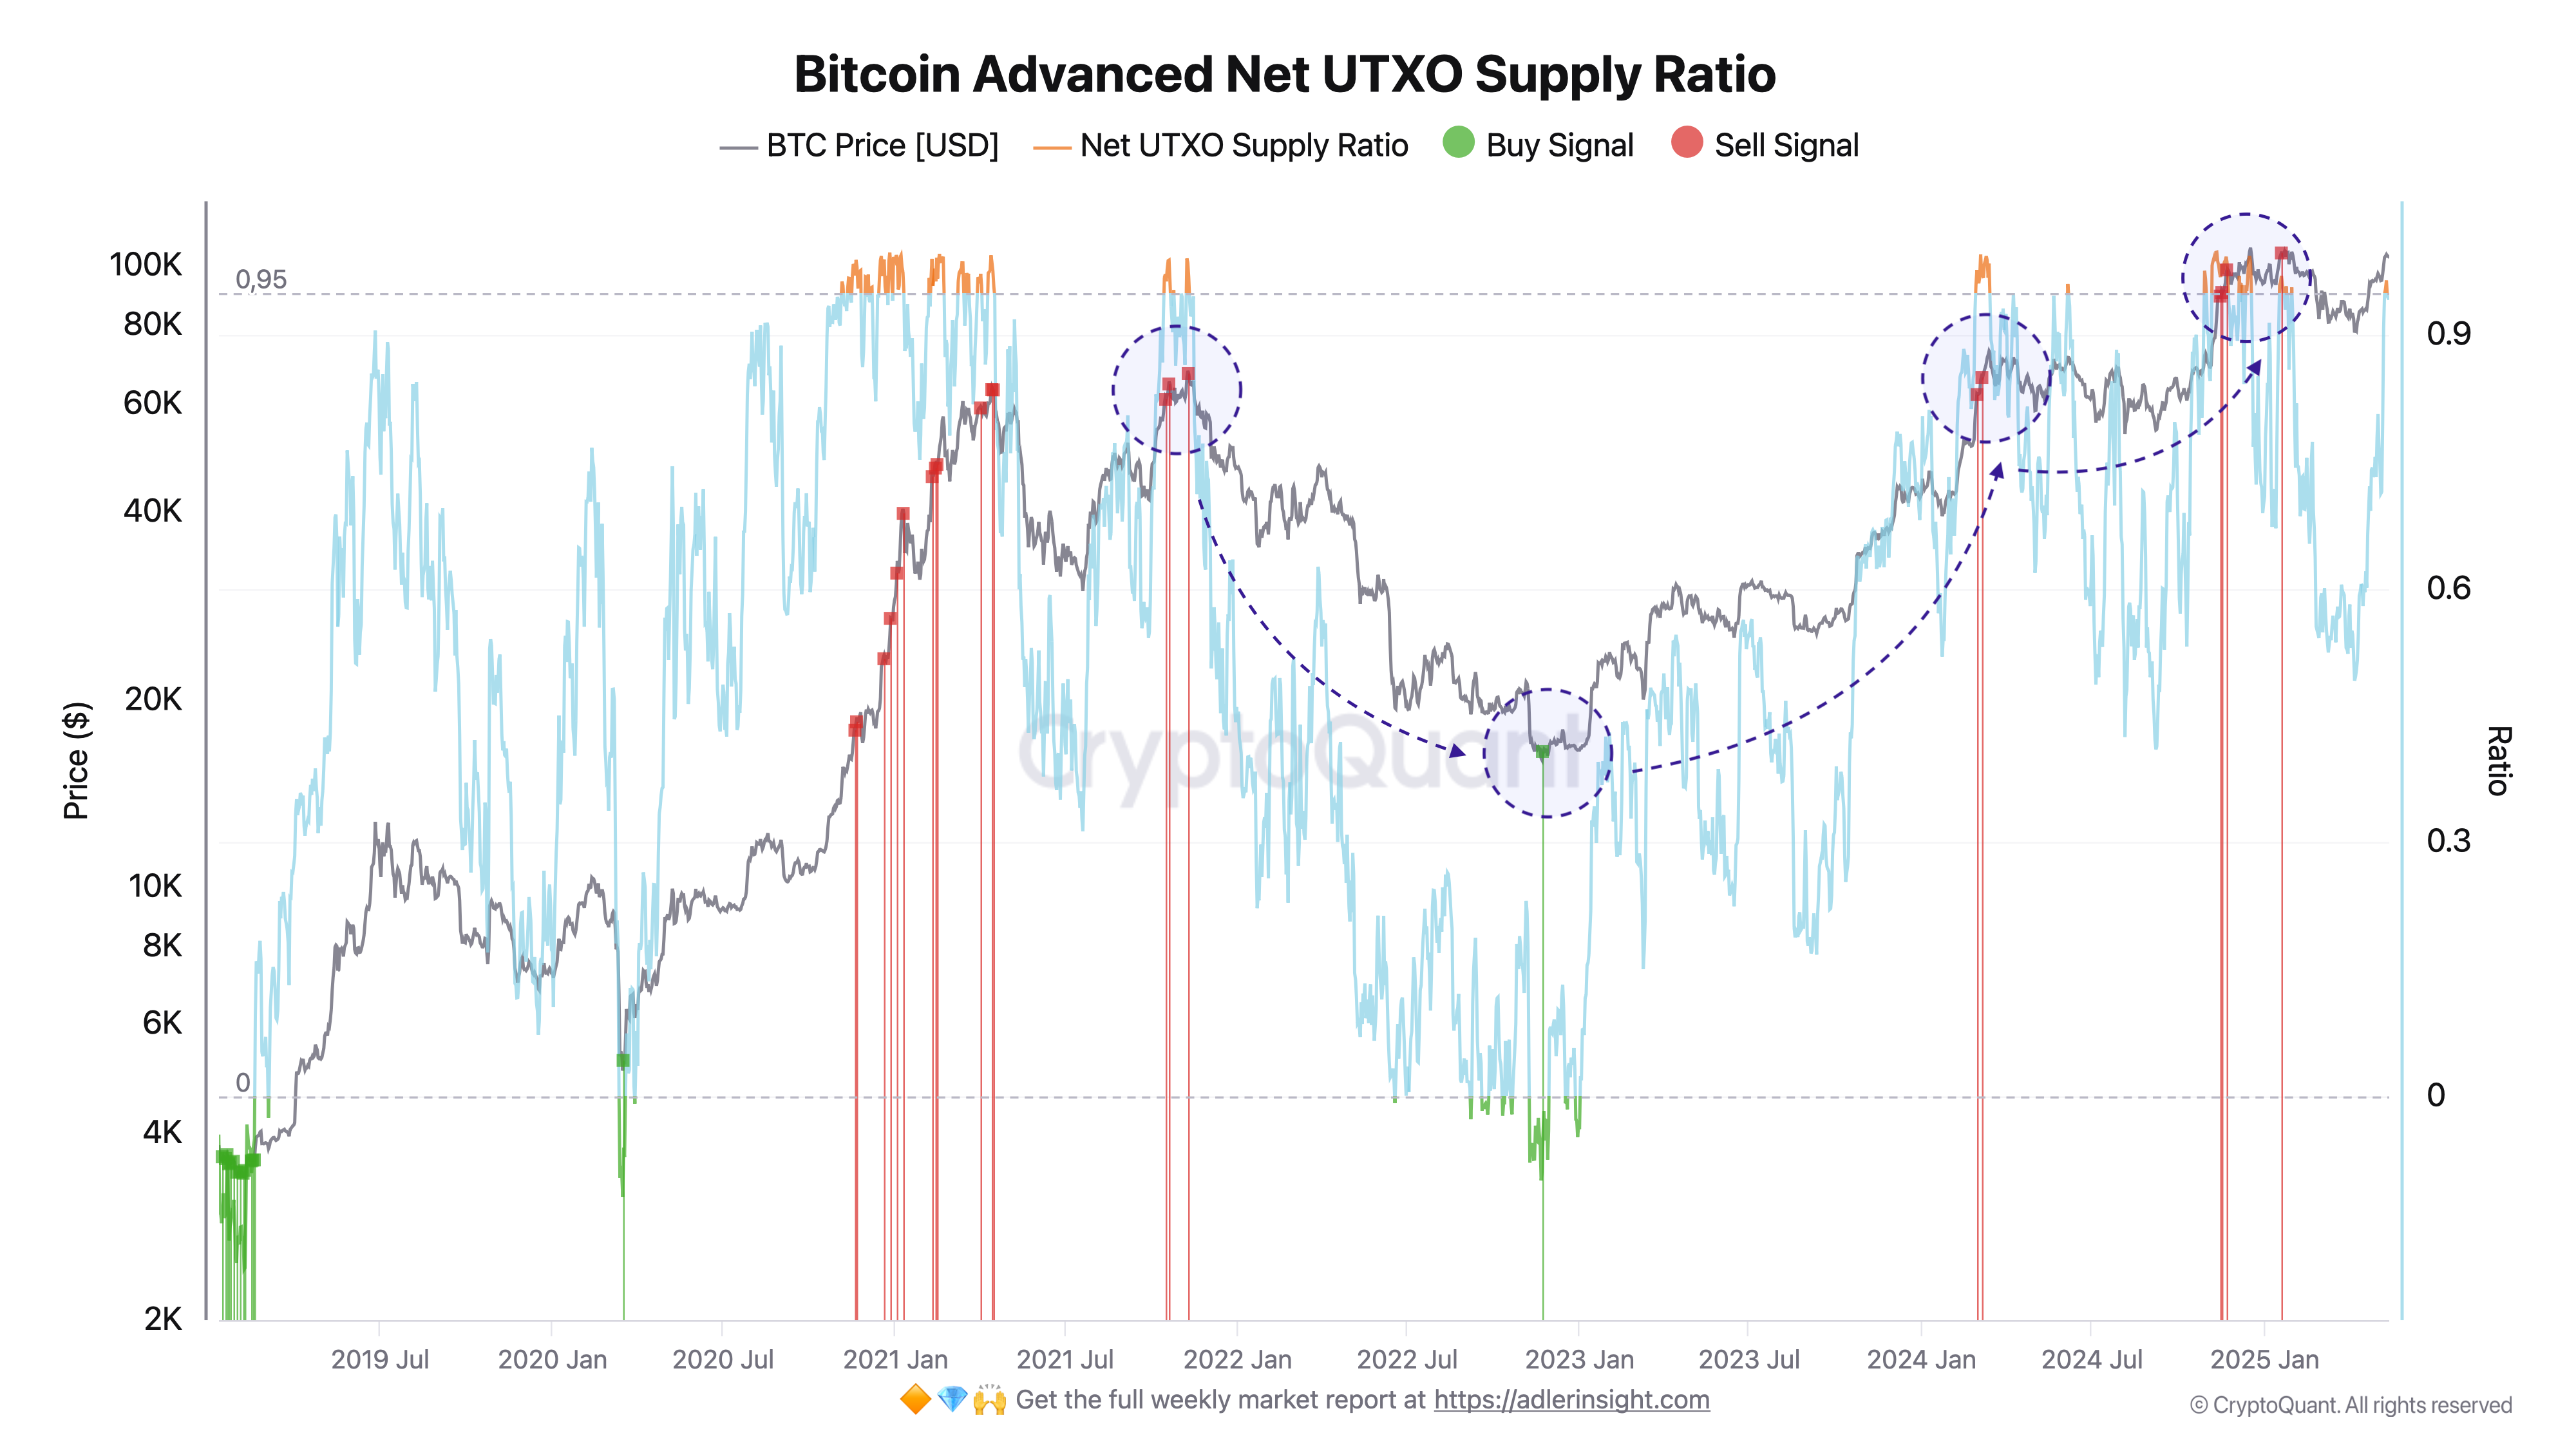
Net UTXO Supply Ratio (NUSR) remains in the 94% zone - this is high but not yet a "red" area. The cluster of fresh Sell signals formed in January 2025 confirmed local overheating, however after a short pause price entered a new impulse phase. As long as NUSR hasn't held ≥ 0.95 for three consecutive days and reversed down, it's early to speak of rally's final peak.
1. How the Metric Works

Conclusion: First series of red bars usually isn't "point of no return," but clearly signals distribution beginning and sharp upside narrowing.
2. Current State (May 18, 2025)

Chart Nuances
Light orange "caps" above 0.95 indicate actual extremum moments - now they're just appearing, meaning final euphoria stage is still forming.
NUSR remains highly volatile: every 4-6 weeks shows pullback to 0.50-0.60. This is normal for late bull market phase.
Red bar cluster in early year didn't kill trend but broke understandable technical "safety" - those who reduced leverage weathered turbulence with less stress.
3. Risks and Invalidation
Structural shift: with growing ETF holder share, portion of coins "exit" UTXO model → metric gradually loses sensitivity. Monitor its correlation with other on-chain P/L indicators (aSOPR, Realized Profit/Loss).
4. Tactical Plan
Main position: hold, as no confirmed Sell scenario exists.
Tactical actions:
At NUSR ≥ 0.95 for three consecutive days and first red price candle - close up to 30% of short-term portfolio.
At NUSR pullback to 0.60-0.65 and price near $92-95K - return half of what was sold per model signal.
Summary
Metric clearly signals: we've entered late but not yet extreme bull macro cycle phase. Last Sell signal gave timely market "exhale," now NUSR again approaches dangerous overheating zone, but reversal confirmation is still absent.
Key trigger: holding NUSR ≥ 0.95 ≥ 3 days + metric and price decline. Until then "disciplined holding with staged profit-taking" strategy remains optimal.
Daily Return on Realized Price (30-Day SMA)
What Does Network "Temperature" Say?

What is DRP-30DMA and Why It Matters
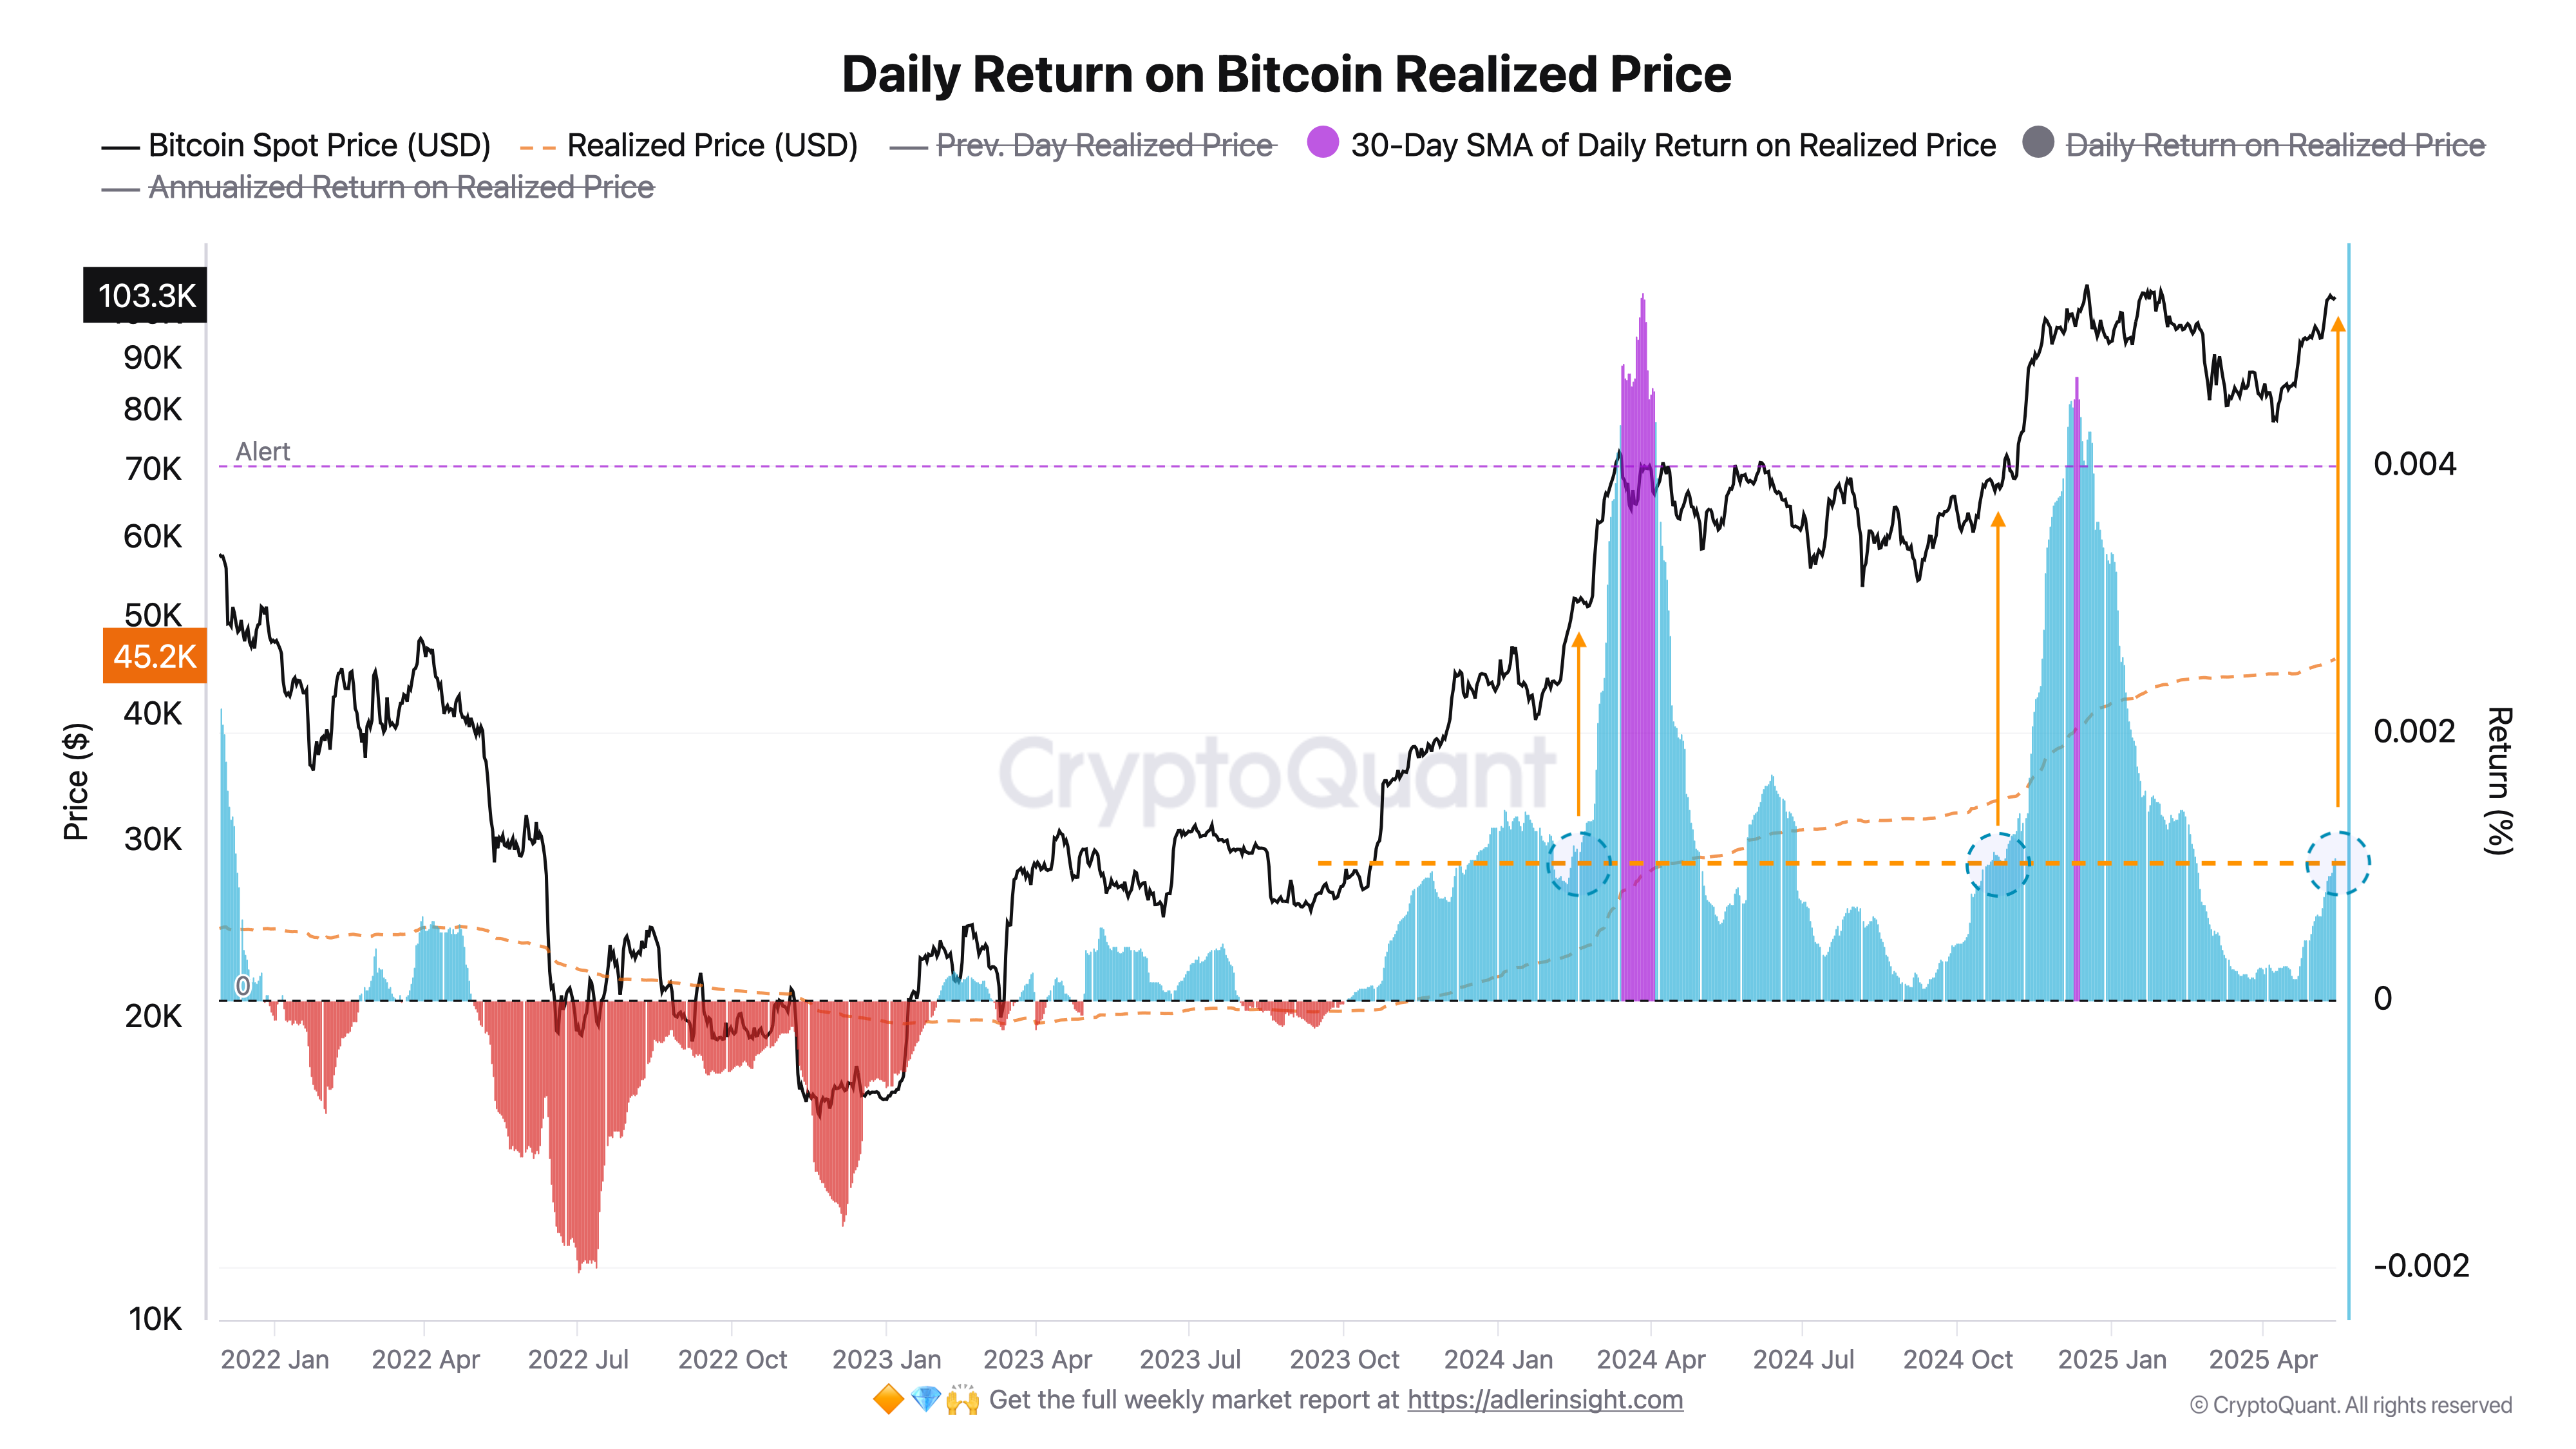
Daily Return on Realized Price (DRP) = (RPₜ − RPₜ₋₁) / RPₜ₋₁
Shows how fast "fair cost basis" of coins grows or falls.30-day SMA smooths noise and works as capital inflow/outflow sensor on-chain.
Higher DRP-30DMA, faster new money flows into market and greater risk that movement becomes "crowded trade."
Key Observations - May 2025
Temperature - warm but not boiling
Current DRP-30DMA ≈ 0.0011 (0.11%) — this is middle of "normal expansion."Reversal above zero played out January "reset"
Since April moving average steadily rising → confirms fresh capital inflow supporting impulse above 100K.Reserve to critical overheating ≈ 90 bps
Historically Alert zone ≥ 0.002 narrowed upside to 2-4 weeks, now we're only halfway.
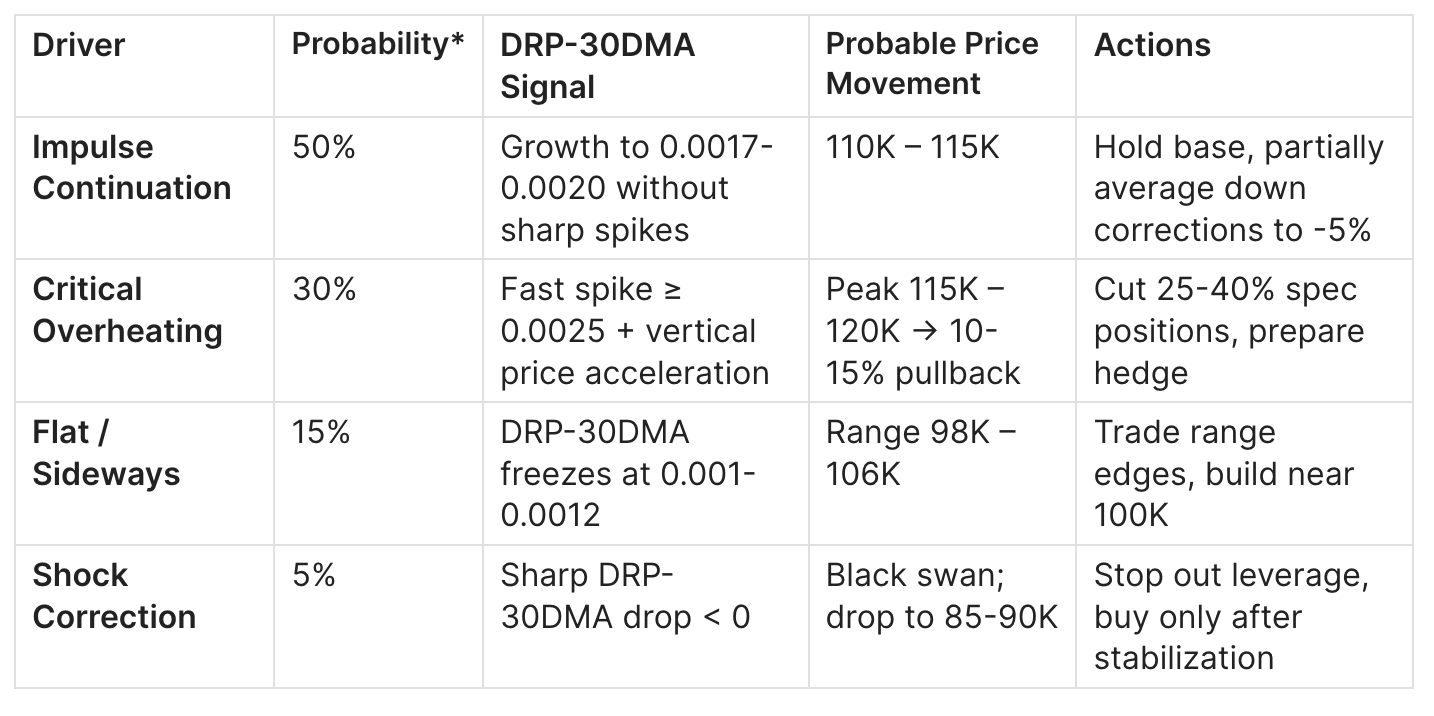
Scenario Tree for June–July 2025
How to Connect DRP-30DMA with Net UTXO Supply Ratio

→ For now two models say:
(1) market heated but not overheated.
(2) window for "final push" to 115K remains open.
Summary
Daily Return on Realized Price (30-Day SMA) serves as faster "thermometer" than NUSR. Today it shows healthy but still controlled heating - market capable of adding 10% before entering critical overheating phase. Need to watch for double confirmation (DRP-30DMA ≥ 0.002 + NUSR ≥ 0.95): exactly this combination in past cycles warned of peak with ±2 week accuracy. For now, impulse continuation scenario to 115K remains baseline.

Conclusion
Despite strengthening "risk-off" factors in macroeconomics - Michigan index decline, Moody's US rating downgrade and weak construction statistics - crypto market maintains bullish bias. ETF flows, corporate and sovereign BTC purchases, as well as exchange infrastructure expansion (Coinbase S&P 500 listing, eToro IPO) create countervailing demand that compensates for short-term investor wariness in US stocks and debt.
On-chain metrics confirm market is heated but not overheated: Net UTXO Supply Ratio holds at 0.94 (< critical 0.95), while 30-day SMA Daily Return on Realized Price is only in middle of "normal expansion." This preserves room for impulse over next 4–6 weeks, however double crossing of NUSR ≥ 0.95 and DRP-30DMA ≥ 0.002 thresholds will signal distribution phase, after which 10-15% correction is likely.

Forecast
Investment Recommendations: 🟢 OUTPERFORM (Moderate Buy)
More details about the rating can be found at this link:
https://adlerinsight.com/Adler_Insight_Rating.pdf
Good luck in the upcoming trading week!
AAJ
Disclaimer:
This material has been prepared solely for informational purposes and does not constitute an offer, recommendation, or solicitation to buy or sell any securities, digital assets, or other financial instruments. The information presented in this report is considered reliable, however, its accuracy or completeness is not guaranteed. Past performance is not indicative of future results. Any investment decisions are made by the investor independently, taking into account personal financial circumstances and, if necessary, after consultation with a qualified professional. The author and affiliated parties may hold positions in the assets mentioned in this report. The author and publisher accept no responsibility for any direct or indirect losses arising from the use of this information.
Risks:
High volatility may lead to sharp fluctuations in value, adversely affecting investors' portfolios. Significant price swings may reduce the attractiveness of BTC to institutional investors, especially in the derivatives segment (futures, options). Potential tightening of regulatory requirements by governments and central banks may restrict access to BTC markets and reduce liquidity. Issues with custodial services, centralized exchanges, and hacking incidents could undermine confidence in the asset and negatively impact liquidity.
Wonderful review as usual! Thank you!
Would you have a link please to your chart Bitcoin Advanced Net UTXO Supply Ratio? The most similar one I could find on CryptoQuant was Bitcoin: UTXOs in Profit (%) https://cryptoquant.com/asset/btc/chart/network-indicator/utxos-in-profit-percent?window=DAY&sma=0&ema=0&priceScale=log&metricScale=linear&chartStyle=line