


Bitcoin Trends – W4 May 2025
New ATH, macro "risk-off" intensifies and bullish momentum cools to 14% - what's next?

TL;DR:
Despite intensified US protectionism and rising demand for "safe havens," Bitcoin ETF inflows, corporate purchases, and continued coin outflows from exchanges keep BTC price at $107K after forming a new record. However, 30-day momentum weakened by 9%, signaling rally deceleration and increased probability of sideways movement until a new catalyst emerges.

Macroeconomics over the past week
Priority: High
US 10-year Treasury bonds cheapened to 4.45%
Yields dropped from a three-month high of 4.64% amid new threats to introduce 50% tariffs on imports from the EU, intensifying concerns about growth due to unpredictable US trade policy. An additional factor was the expectation of increased budget deficit after the House of Representatives passed a tax bill that, according to CBO estimates, will add nearly $4 trillion to the current federal debt of $36 trillion.Gold rose more than 1.5% to $3,350 per ounce
The metal benefited from increased market nervousness: threats of tariffs on the EU and Apple, as well as concerns about US fiscal sustainability pushed investors into "safe havens." For the week, gold gained about 3%, also fueled by geopolitical news about escalation in the Middle East.DXY index held at 99.5, a low for more than two weeks
After statements about 50% tariffs on the EU and threats to Apple, DXY reduced losses, reflecting revived concerns about aggressive trade policy that limits demand for dollar assets and contributes to outperforming growth of European and Asian instruments.
Priority: Moderate
Frankfurt DAX closed at 23,612, down 1.5%
Sharp sell-off followed US threats to impose duties against the EU and Apple, with almost all sectors - banks, automotive, pharma, IT - ending the session in negative territory.Germany's Q1 GDP growth revised from 0.2% to 0.4%
The improvement is explained by sustainable foreign trade turnover and consumer demand.House tax bill could increase US deficit by $3-4 trillion
The document was sent to the Senate and is projected to add nearly $3 trillion to the federal deficit over the next decade, stimulating pressure on long-term interest rates.
Priority: Low
Week ahead (starting May 26)
US: personal income and spending, PCE price indices, durable goods orders, goods trade balance, Q1 GDP revision, corporate profits, new home sales, S&P/Case-Shiller home price index, Fed officials' comments and FOMC minutes.
Global data: central bank decisions from South Korea and New Zealand, inflation in France, Spain, Italy and Germany, Q1 GDP in Turkey, India, Brazil and Canada, Germany GfK consumer confidence, industrial production, retail sales and consumer confidence in Japan.
Note:
Intensifying "risk-off" in US debt instruments sector
The fall in 10-year Treasury yields to 4.45% indicates growing demand for "bottomless" assets amid tariff uncertainty and prospects of increased budget deficit. Investors are reducing exposure to US credit securities, preferring more reliable government bonds from developed markets.Growing demand for "safe havens"
Accelerated gold price rise (+1.5% per day, +3% per week to $3,350) and Treasury bond rebound reflect global nervousness: trade disputes and US fiscal risks push part of capital from stocks and corporate debt into defensive instruments.Dollar weakening and capital redistribution
DXY index at a two-week low (99.5) indicates declining dollar rate attractiveness and serves as a catalyst for European and Asian asset growth. This opens a window for emerging markets and currencies, reducing correlation with the dollar.Pressure on European stocks and credit securities
Frankfurt DAX fell 1.5% due to the risk of American tariff introduction: European exporters are least protected from retaliatory measures, increasing volatility in industrial and banking sectors.US equity risks persist
Upcoming data on consumer spending, PCE and corporate profits create additional uncertainty: weak figures will intensify correction in technology and cyclical segments, while housing market resilience may briefly support "risk-on" sentiment.Differentiation within asset classes
Within risk assets, there's redistribution in favor of pseudo-defensive stories: gold and digital gold (Bitcoin) receive additional interest as hedging instruments for fiscal and trade risks, while highly cyclical stocks and high-yield bonds look most vulnerable.Restrained optimism for emerging markets
Central bank decisions from South Korea and New Zealand, as well as inflation and GDP statistics in Asia and Europe create prerequisites for partial capital withdrawal from the US: good growth data in some economies may support local stock and bond markets.
Overall picture: in the near term, a moderately "risk-off" background persists, but within risk asset classes there's a trend toward diversification into defensive and pseudo-defensive instruments, while the most cyclical sectors - especially in the US and Europe - remain under pressure.

Stock market over the past week
Priority: High
Friday results:
S&P 500 fell 0.6%
Nasdaq 100 declined 0.9%
Dow Jones lost 256 points
Conclusion: powerful single-day decline occurred after Donald Trump threatened to impose a 25% tariff on iPhone imports if Apple doesn't start local production, as well as a 50% tariff on all goods from the EU starting June 1. These threats again intensified concerns about protectionism and triggered sell-offs in the technology sector.
Technology sector under pressure:
Apple −3%, market cap fell below $3 trillion
Micron, Qualcomm, Nvidia each lost more than 1%
Conclusion: growth companies are particularly sensitive to tariff news, and recent White House statements intensified investor risks of global trade slowdown.
Week results:
S&P 500 −2.0%
Nasdaq 100 −1.6%
Dow Jones −2.2%
Decline leaders: Apple −3%, Nvidia −2%, Microsoft −1.8%
Growth leaders: energy sector +1.2% (amid geopolitical tensions and rising commodity prices)
Conclusion: the week ended with overall stock index decline due to renewed trade risks and deteriorating consumer sentiment. Investors increased exposure to "defensive" and commodity assets, while high-tech company stocks experienced the greatest pressure.

Important news from the past week
Priority: High
Strategy (formerly MicroStrategy) launches $2.1 billion market program for STRF preferred shares: proceeds will go toward Bitcoin purchases and operating expenses. During the week, the company added 7,390 BTC (~$765 million), bringing the balance to 576,230 BTC.
BlackRock's IBIT ETF fund has attracted $8.9 billion since the beginning of the year, including $6.5 billion in the last month, placing it among the top five largest US ETFs.
Coinbase discloses details of December incident hack: 69,461 accounts were affected, SEC and US Department of Justice opened investigations.
Priority: Moderate
Kraken launches 24/7 trading of tokenized stocks Apple, Tesla and Nvidia for non-US residents (Europe, Latin America, Africa, Asia).
South Korea will lift the ban on institutional cryptocurrency operations in June, but will strengthen KYC requirements for exchanges and banks to combat money laundering.
Priority: Low
Japan's Metaplanet bought an additional 1,004 BTC (current reserve - 7,800 BTC, ~$806 million). The company plans to bring reserves to 10,000 BTC by year-end.
Conclusions
Institutional accumulation continues to dominate: major players are actively expanding their BTC positions, creating sustainable demand and supporting the current bull trend. Product diversity is growing: tokenized stocks on Kraken expand access to "crypto-assets" through familiar instruments, increasing retail and institutional investor engagement. Security remains in focus: consequences of the Coinbase hack remind of the need to strengthen internal measures and increase client trust.

Bitcoin trading week macro analysis
1. BTC/USD pair analysis

Key weekly indicators
Current price: ≈ $107K
New ATH: $111K
Local minimum: $102K
Trend
This week Bitcoin set a new record (ATH) at $111K, then bounced to the $109–$107K zone and entered a "narrow consolidation" stage. The growth was accompanied by increased volumes, especially when breaking through previous resistance at $108K.
Conclusions
Key resistance: $112K Holding above this level on volume will confirm uptrend strength and may lead to range expansion at $115K.
Local support: $109–$107K Holding in this area will preserve bullish momentum and minimize pullback risk.
Strong base support: $103K
A break below the psychological $103K level will intensify seller pressure and may trigger a deeper correction.
2. Bitcoin Price Momentum (30-day)

Over the past 5 days, Bitcoin's 30-day momentum decreased from 23% to 14%, indicating slowing upward pressure. The momentum drop to 14% coincided with a series of neutral macro news that didn't provide sufficient drive to continue the rally. As a result, momentum now fluctuates around 14%, where price will likely remain in a sideways range until a clear catalyst appears.
Conclusions
Momentum below 20% indicates weakening buying enthusiasm and increased probability of flat movement.
Momentum recovery above 20% on high volumes will signal a new rally and ATH test.
3. Options analysis

Market structure
Call option dominance:
Green bars are concentrated at $115K–$125K strikes, with peaks at $125K (≈ 95M) and $120K (≈ 75M), then $117.5K (≈ 60M). This indicates active growth insurance in the zone above current price.Put options:
Red bars dominate at $50K–$55K strikes, with maximums at $50K (≈ 110M) and $52.5K (≈ 80M). Put volumes sharply decrease after $55K, reflecting defensive position shift to the lower range.
Comparative analysis with previous week
Max Pain change:
Max Pain level decreased from $102K to $100K, indicating redistribution of interests toward defensive levels closer to the market.Volume dynamics:
Call volumes at $120K–$125K strikes increased compared to last week, while the $112.5K–$115K zone shows slight reduction.
Put volumes at low strikes ($50K–$55K) increased, while the $75K–$82.5K range continued declining.
Forecast
Possible growth:
If support at $100K holds and Call volumes continue growing, expect testing of the $102K–$104K zone, and with confident breakout - movement to $110K.Correction risks:
Breaking $100K level with simultaneous Put volume growth may return price to the $97K–$99K range, where main "bear" protection is concentrated.

Bitcoin network data analysis

1. Number of Active Wallets (7d):
Previous Week: 8,629,838
This Week: 8,063,323
Change: 🔴 −6.56%
Comment: A 6.5% decrease in active addresses indicates consolidation, with some retail users leaving short speculation.
2. Network Hashrate:
Previous Week: 864,817,437,876 EH/s
This Week: 852,722,089,094 EH/s
Change: 🔴 −1.40%
Comment: Minor hashrate decline (<1.5%) related to seasonal maintenance or capacity redistribution — network security remains at high level.
3. Market Capitalization:
Previous Week: $2,049,167,408,787
This Week: $2,141,332,707,976
Change: 🟢 +4.50%
Comment: Capitalization growth corresponds to 3.5% price increase.
4. Transfer Volume (7d):
Previous Week: 4,301,462 BTC
This Week: 4,672,535 BTC
Change: 🟢 +8.63%
Comment: Significant growth in transfer volumes indicates strengthening major retail activity on blockchain, creating selling pressure.
5. Market Price:
Previous Week: $104,214.25
This Week: $107,839.92
Change: 🟢 +3.48%
Comment: Over the past week, price continued moving up, updating local highs.
6. BTC Exchange Reserves:
Previous Week: 2,435,318 BTC
This Week: 2,418,018 BTC
Change: 🔴 −0.71%
Comment: Gradual coin outflow from exchanges strengthens the foundation for further growth.
Conclusions
Global bull trend: price and capitalization growth amid exchange outflows.
Retail consolidation: significant decrease in active wallets indicates focus shift to major participants.
Network remains reliable: minor hashrate fluctuation doesn't affect overall security.

On-chain metrics
Bitcoin Advanced Net UTXO Supply Ratio
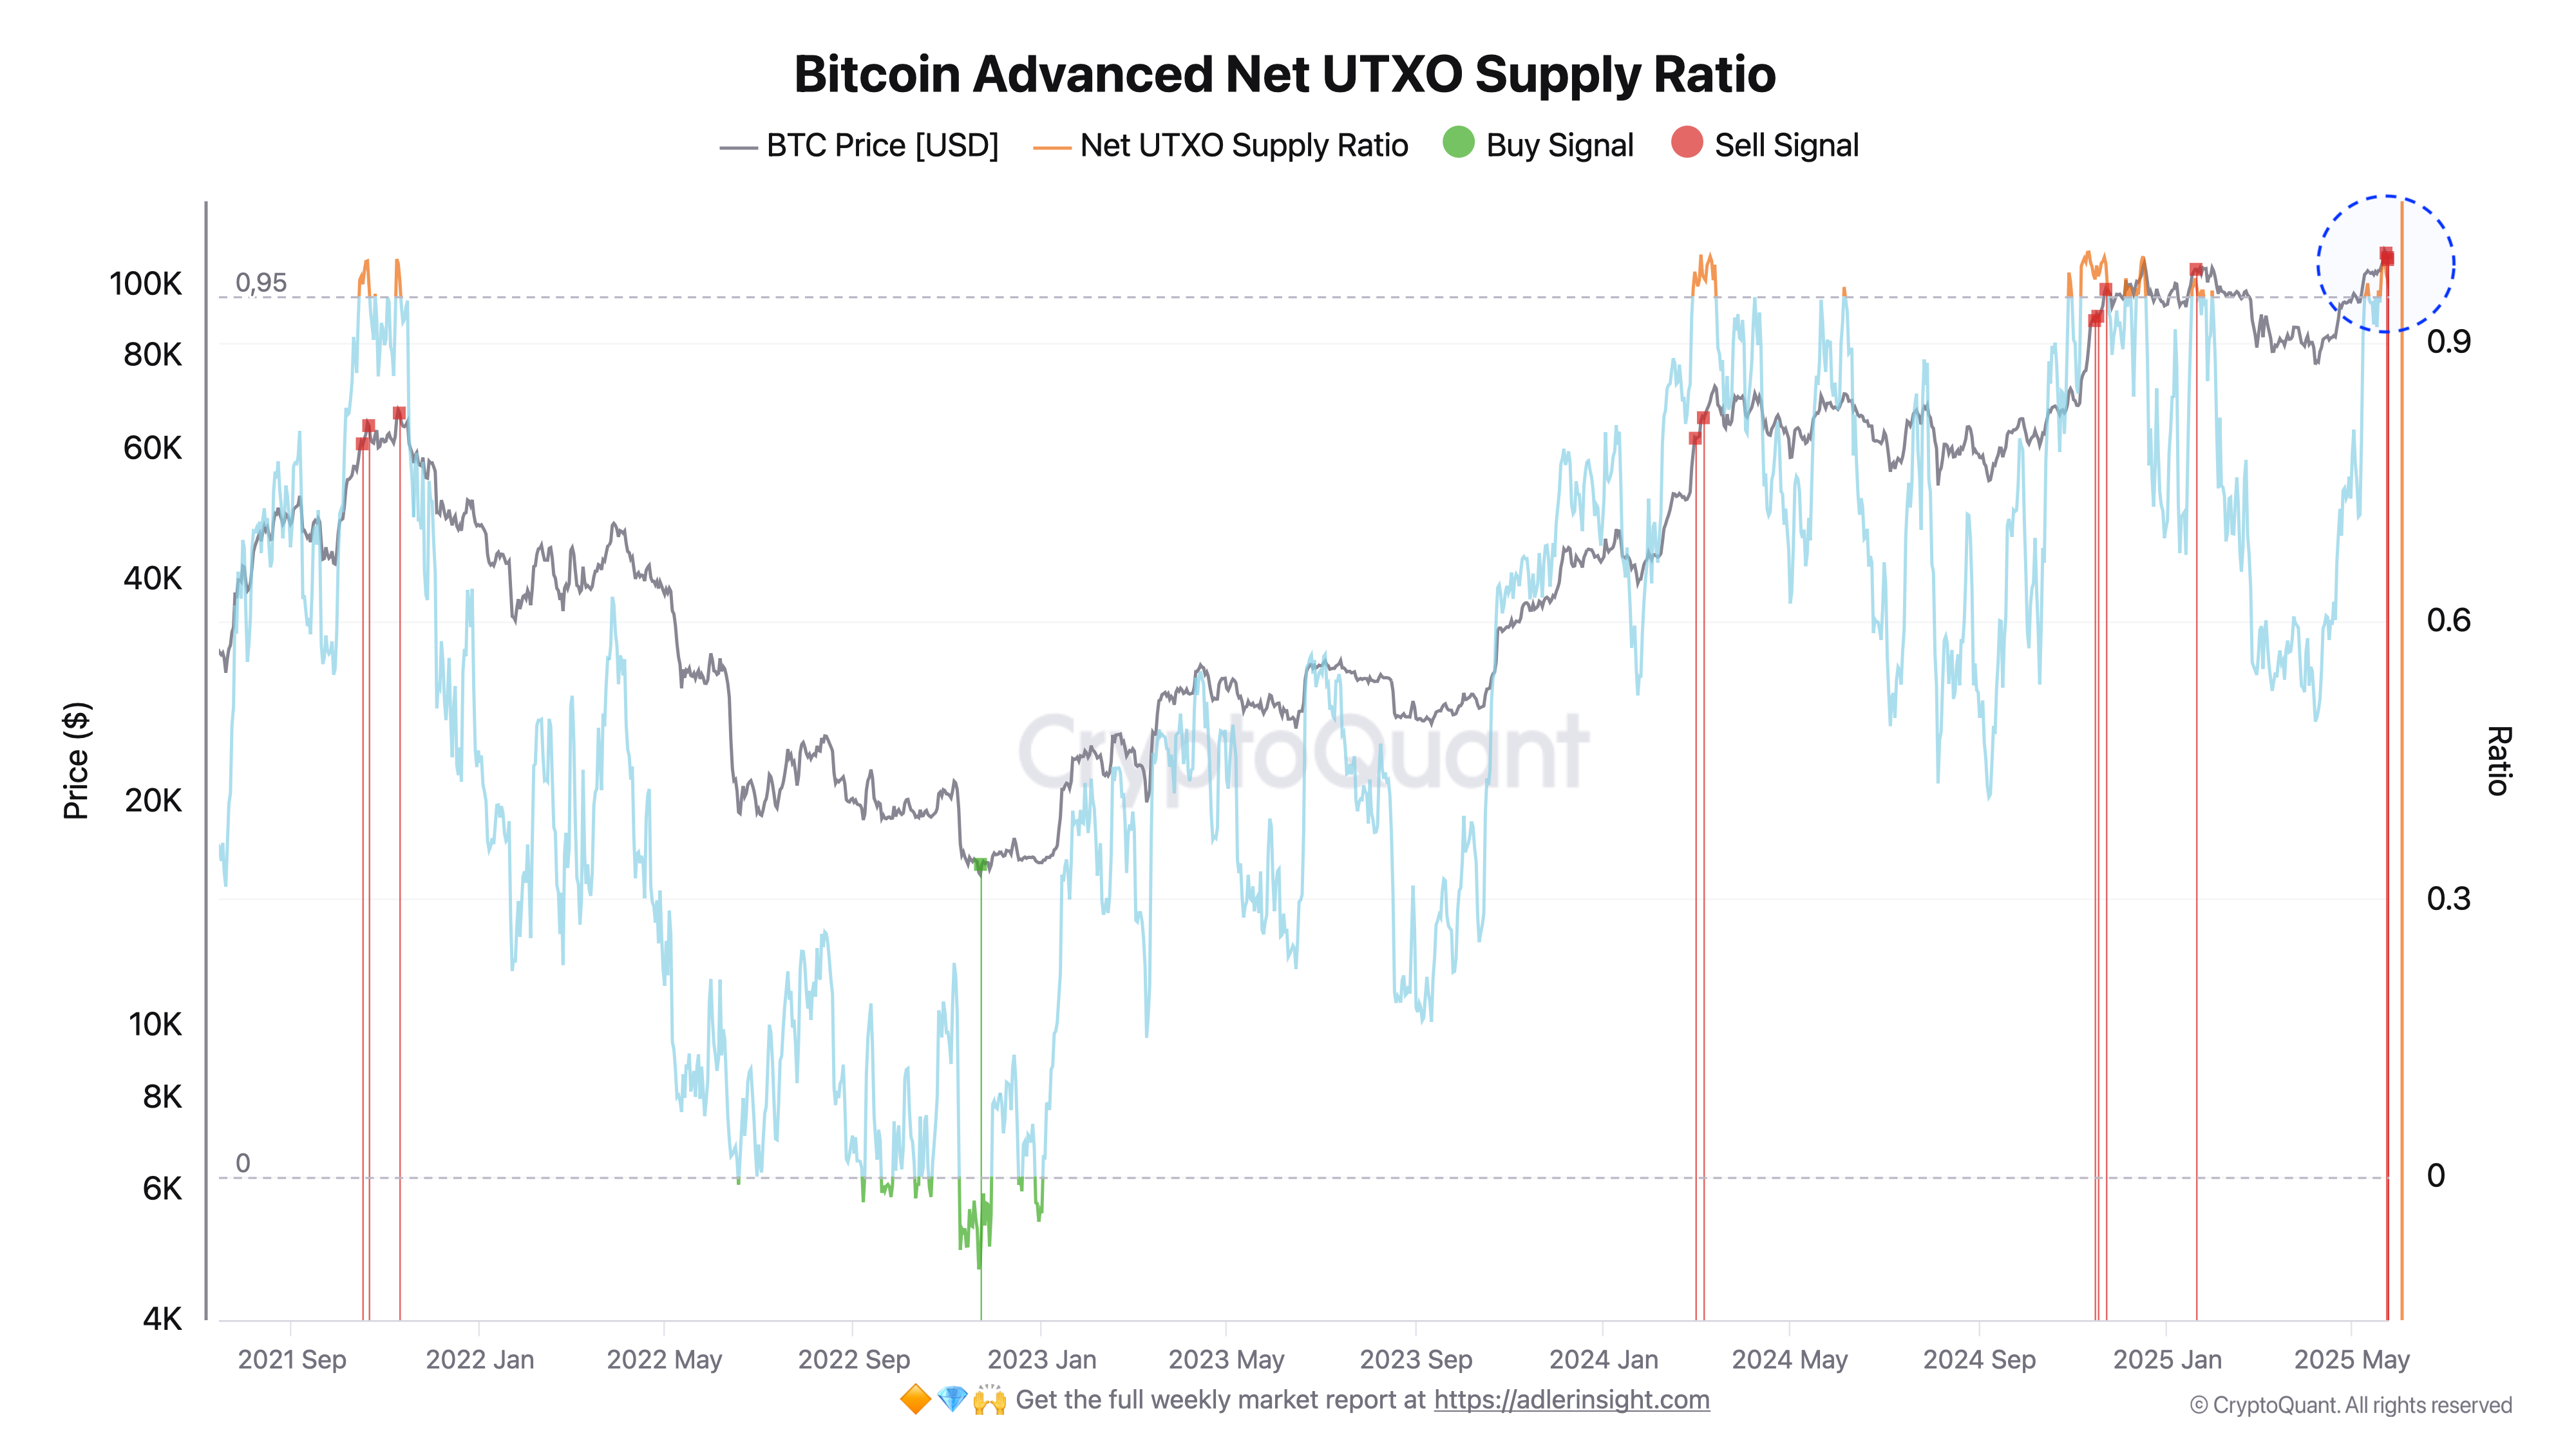
This week, Net UTXO Supply Ratio held > 0.95 for three consecutive days and turned down, forming a new 🔴 Sell signal. Price reacted with a pullback after updating the local peak.
Current state (May 25, 2025)

Chart nuances
NUSR pullback to 0.90–0.92 amid small price decline hasn't yet broken the medium-term bull trend.
NUSR volatility remains high: periodic pullbacks to 0.50–0.60 are still normal, but attention is now on the extreme 0.95 level.
1. Risks and invalidation
Metric loses sensitivity as the share of "immovable" ETF coins grows - important to compare NUSR with other P/L indicators.
Signal cancellation: NUSR reversal back up and holding > 0.95 for three consecutive days or $110K breakout from below.
2. Tactical plan
Profit taking: close up to 30% of short-term position.
Remainder management:
Hold remaining 70%, but prepare for further decline.
With NUSR correction to 0.60–0.65 and price $92–95K - gradually restore up to 50% of sold volumes.
Monitoring: track coincidence of NUSR reversal and false price level breakouts to filter "noise".
Summary
We entered macro distribution phase: confirmed Sell signal suggests taking partial profits and reducing exposure. Network analysis shows large players are distributing some profits at ATH levels - Transfer Volume (7d) metric.
Bitcoin Peak Signal

The metric signals worked reliably in 2013–14, 2017–18 and 2021 - precise local peak markers. During those periods, the following were simultaneously observed:
MRPI ratio of BTC price to realized price of long-term holders
VDD Ratio ratio of 30-day VDD to 365-day VDD - race of old coin movement volumes relative to annual SMA
Currently we're in the late growth stage: both sub-metrics are gradually strengthening, but not yet close to historical extremes.
Summary
Peak Signal shows we haven't yet reached the upper phase of the bull cycle. Until MRPI and VDD Ratio overcome their historical thresholds, the key task is to hold position and pull up medium-term targets, but not fix large volumes.
Bitcoin Halving Cycles
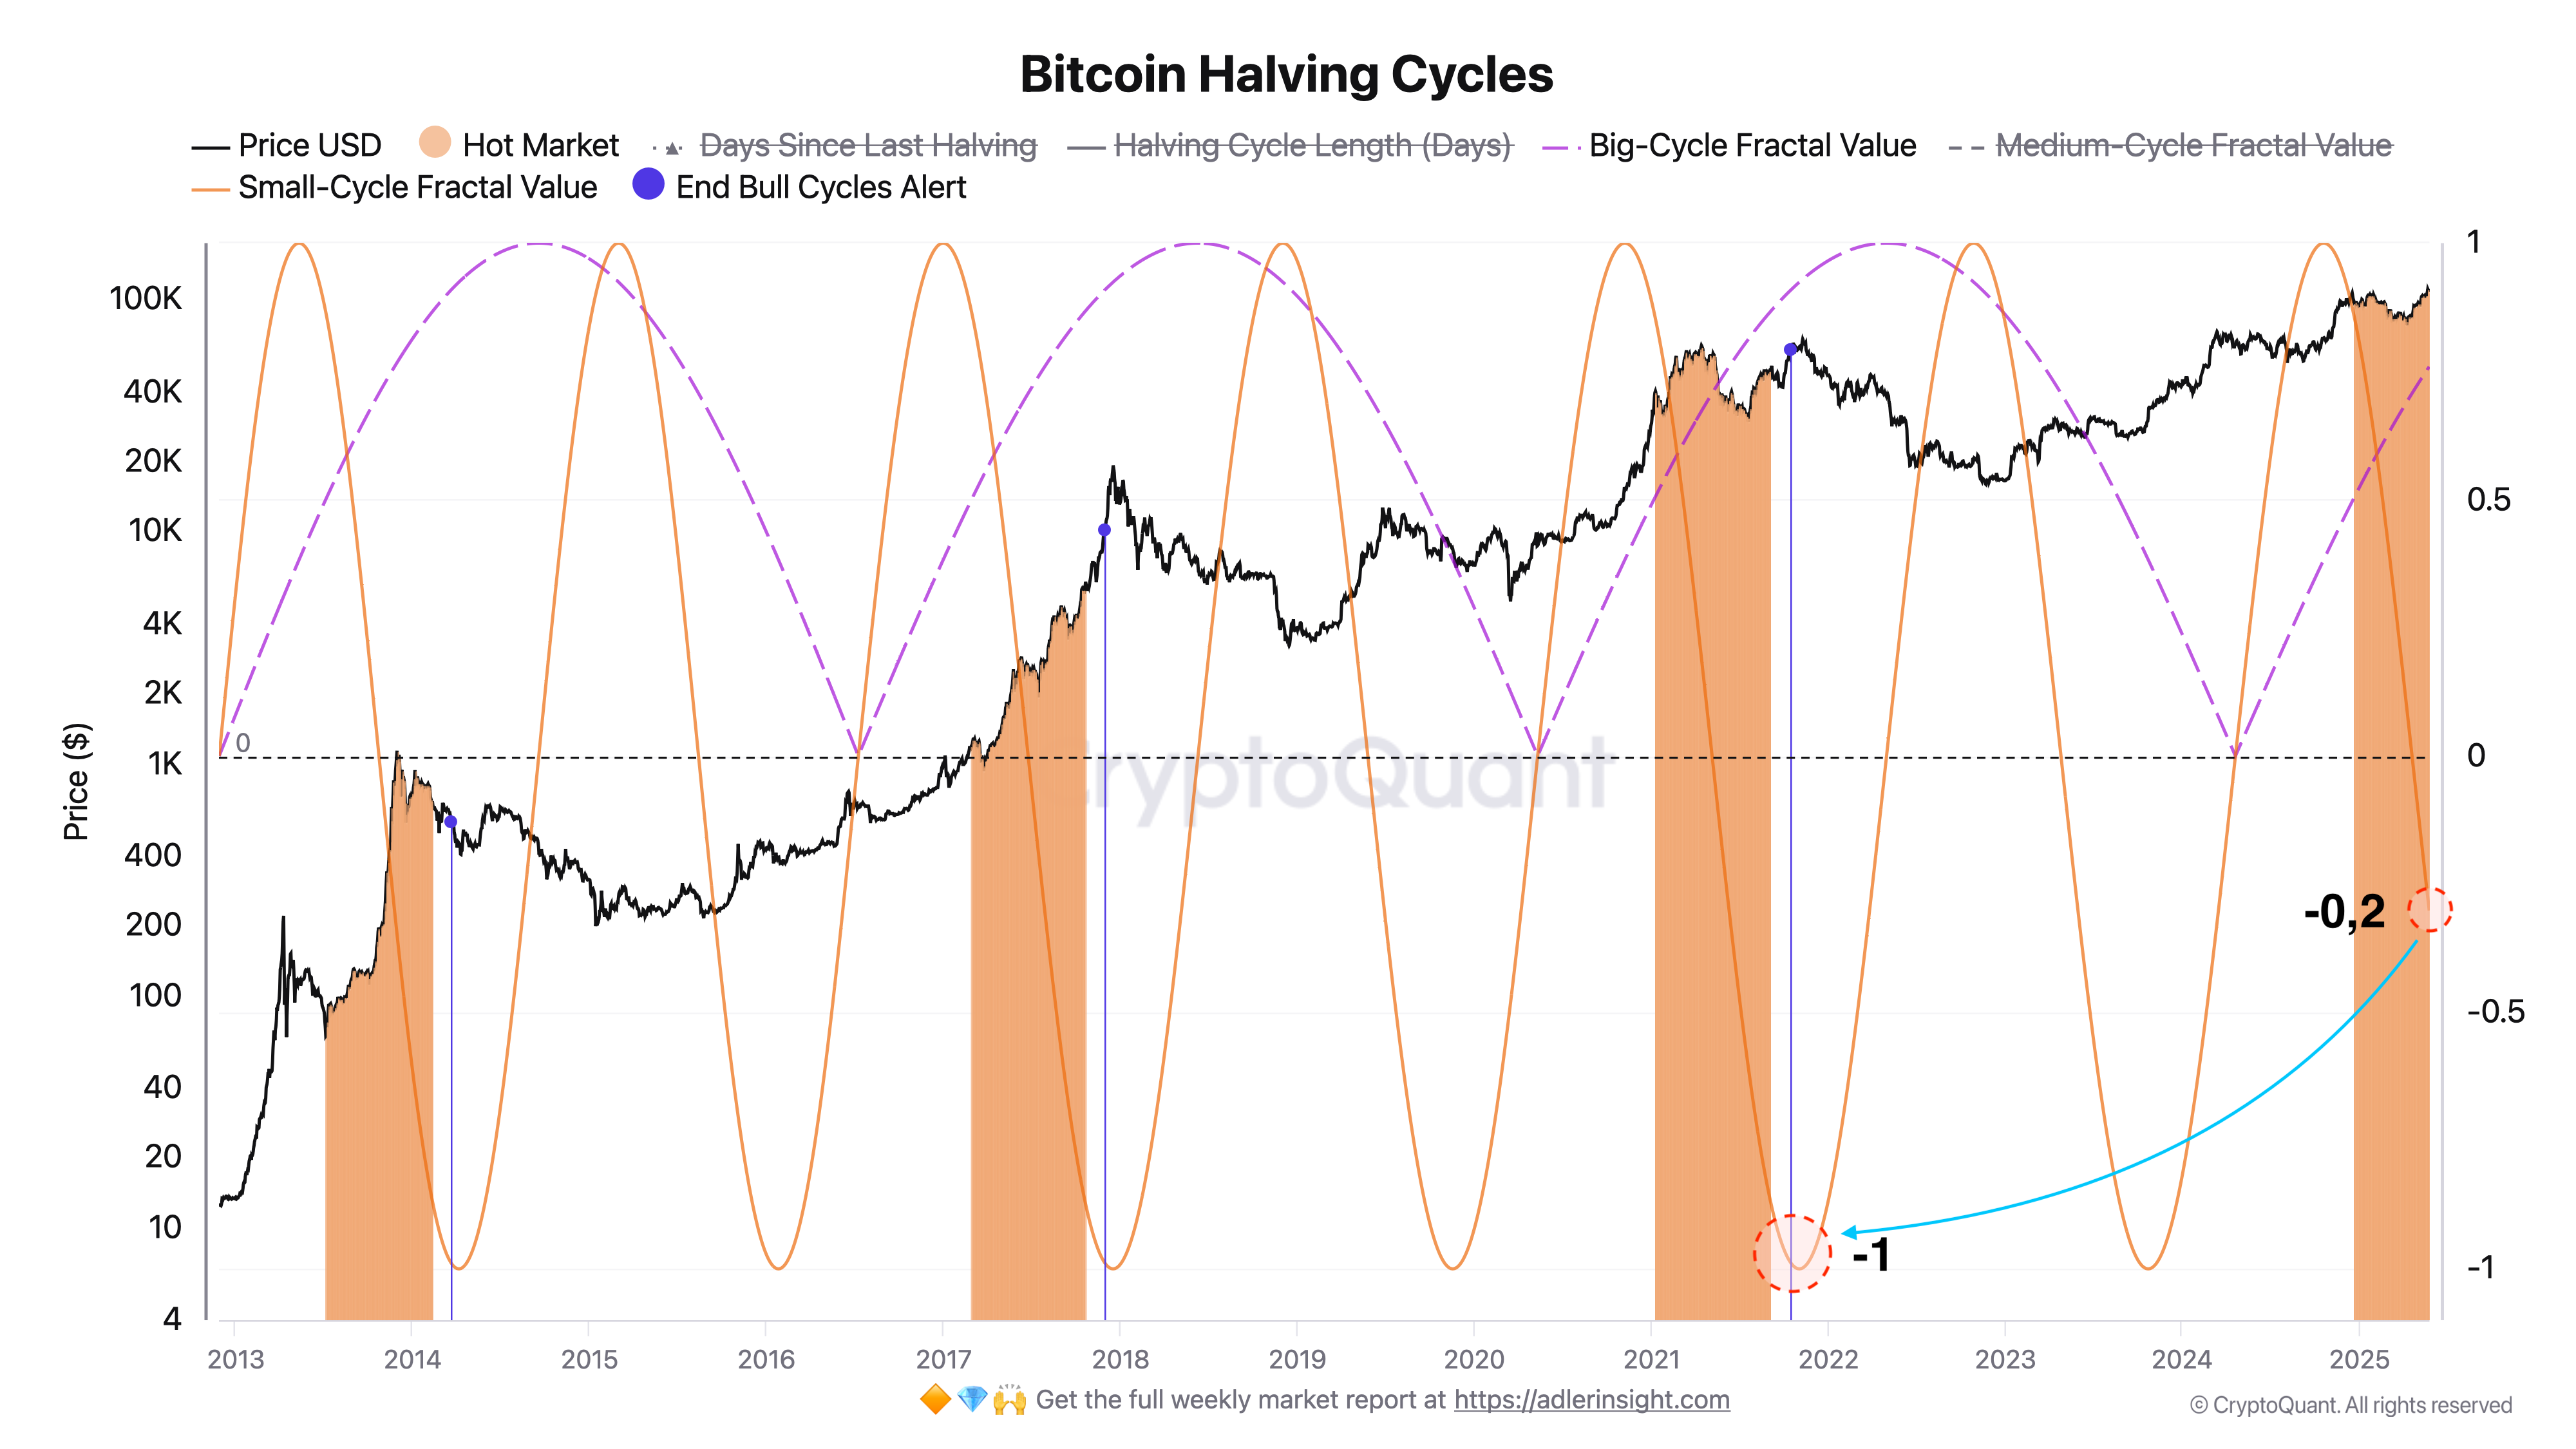
This model divides each halving cycle into three "fractal" waves defined by sinusoids:
Big-fractal – sine with full cycle period (complete interval between halvings, P).
Medium-fractal – sine with P/2 period (half cycle).
Small-fractal – sine with P/4 period (quarter cycle).
"Hot" market signals are generated when small-fractal crosses medium-fractal "from above" while in positive zone, end of hot market "End Bull Cycles" - when medium-fractal crosses big-fractal "from above" with small-fractal close to –1 (quarter-cycle wave minimum).
According to this model's assessment, the signal for this cycle's finale should appear in fall 2025, which you'll learn about from this newsletter.

Conclusion
Bitcoin is in a phase of high institutional support amid deteriorating macro fundamentals: UST yields are declining, gold is near new highs, and DXY remains under pressure. IBIT flows and Strategy purchases form a demand "cushion," allowing BTC to set new ATHs even with cooling retail activity and negative political and economic risks.
Nevertheless, weakening 30-day momentum and fresh NUSR Sell signal indicate transition to macro profit distribution phase. Short-term tactics - partial fixing and monitoring $107K support, range holding will confirm bull trend strength, while break below opens path to deeper correction before new demand wave.

Next week forecast
Investment recommendations: 🟣 HOLD (Neutral)
More details about the rating can be found at this link:
https://adlerinsight.com/Adler_Insight_Rating.pdf
Good luck in the upcoming trading week!
AAJ
Disclaimer:
This material has been prepared solely for informational purposes and does not constitute an offer, recommendation, or solicitation to buy or sell any securities, digital assets, or other financial instruments. The information presented in this report is considered reliable; however, its accuracy or completeness is not guaranteed. Past performance is not indicative of future results. Any investment decisions are made by the investor independently, taking into account personal financial circumstances and, if necessary, after consultation with a qualified professional. The author and affiliated parties may hold positions in the assets mentioned in this report. The author and publisher accept no responsibility for any direct or indirect losses arising from the use of this information.
Risks:
High volatility may lead to sharp fluctuations in value, adversely affecting investors' portfolios. Significant price swings may reduce the attractiveness of BTC to institutional investors, especially in the derivatives segment (futures, options). Potential tightening of regulatory requirements by governments and central banks may restrict access to BTC markets and reduce liquidity. Issues with custodial services, centralized exchanges, and hacking incidents could undermine confidence in the asset and negatively impact liquidity.
Great piece of work as usual! 👍🙏🏼
Great analysis. Thanks for sharing 🤝