


Insight #22
This week, Bitcoin rises amid Trump’s BTC reserve plans and growing institutional interest. The Fed’s rate cut on Dec 18 could boost the market further.

Key Events of the Past Week:
Donald Trump plans to create a **strategic cryptocurrency reserve** to position the U.S. as a leader in digital assets, boosting Bitcoin’s prospects post-election.
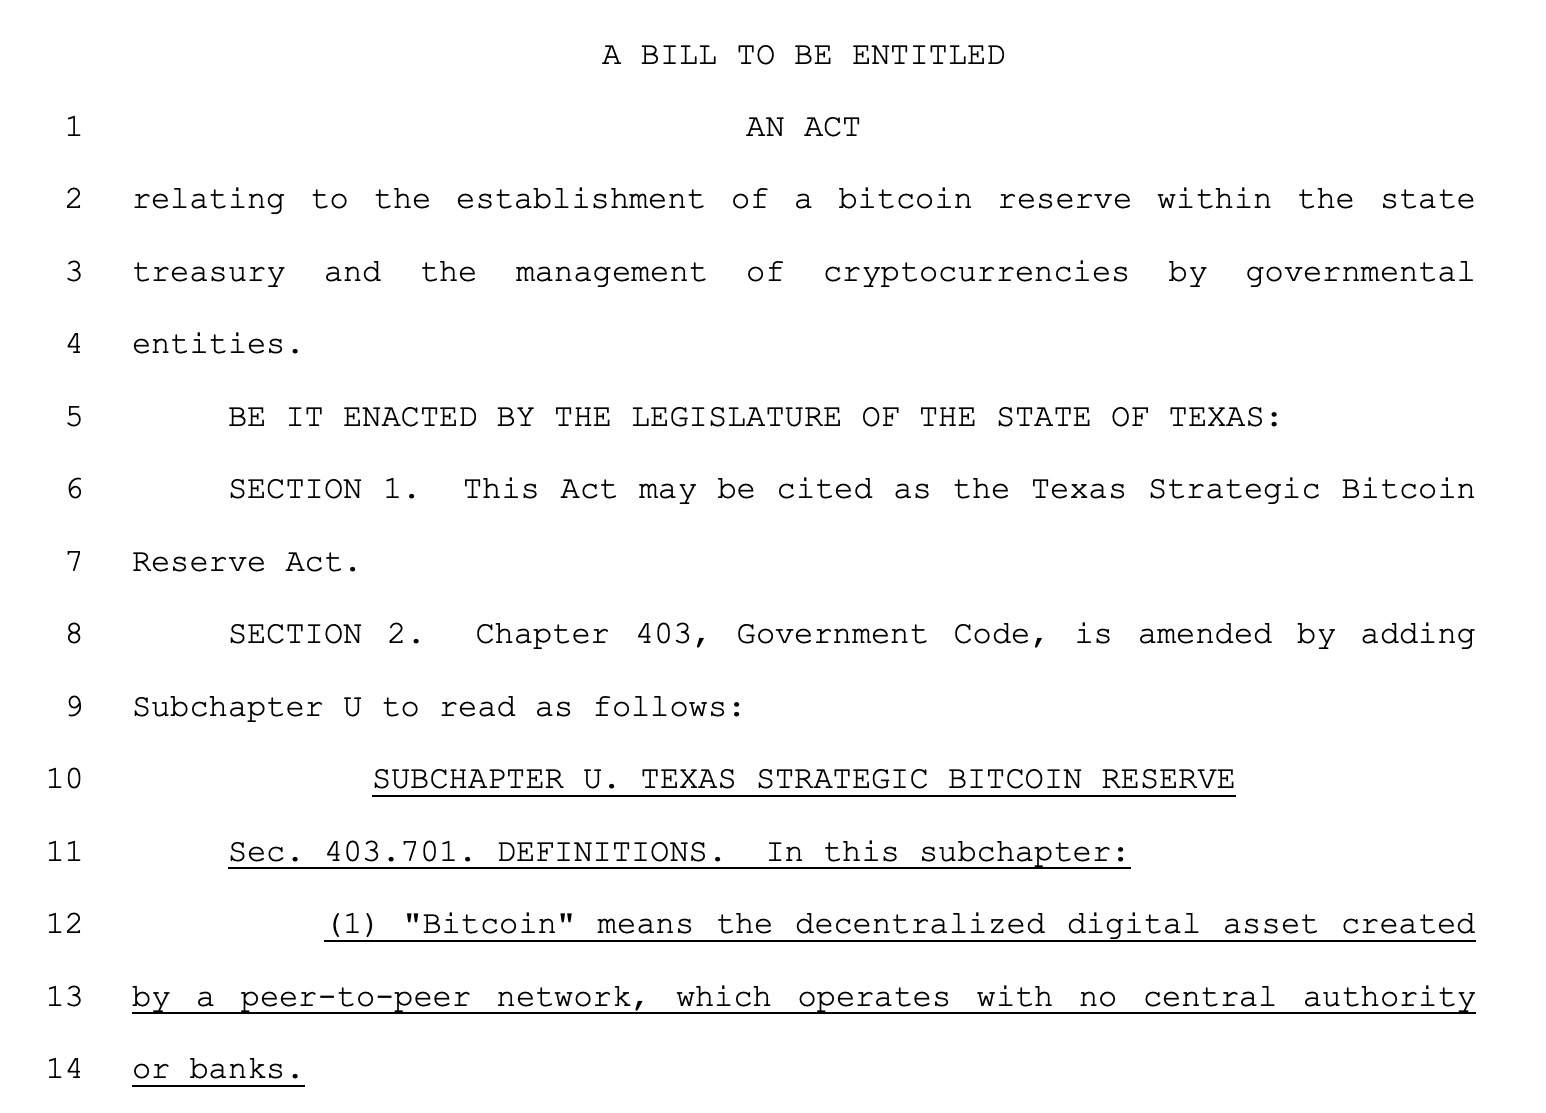
Texas introduces a bill to establish a Bitcoin strategic reserve to enhance financial stability, enable tax payments in Bitcoin, and combat inflation.
Japanese lawmaker Satoshi Yamada questioned the government on adopting Bitcoin reserves, emphasizing U.S. efforts and potential economic benefits.
Polymarket users are 95% confident that the Fed will cut the key interest rate by 25 basis points on December 18th.
The SEC approved NYSE Arca’s filing for the listing of Bitwise Bitcoin and Ethereum ETFs, inviting public feedback on the proposal.
MicroStrategy acquired 21,550 BTC for $2.1 billion, financed through a stock sale, bringing its holdings to 423,650 BTC at an average price of $60,324 per coin.
MARA Holdings purchased 11,774 BTC for $1.1 billion, increasing its holdings to 40,435 BTC and achieving a record-breaking hash rate of 50 EH/s.

Riot Platforms added 5,117 BTC worth $510 million, raising total holdings to 16,728 BTC. Their stock price rose by 7%.
Amazon shareholders have requested the board to consider creating a strategic Bitcoin reserve during the 2025 annual meeting, allocating 5% of assets. Amazon’s assets were valued at $585 billion as of September.
India’s public education platform Jetking Infotrain became the first of its kind to invest in Bitcoin, allocating 26% of its market cap. Its stock surged by 13% following the announcement.
Japanese public company Remixpoint, focusing on energy and automotive sectors, integrated a Bitcoin strategy in November. After acquiring 13 more BTC, its holdings reached 282 BTC, driving a 170% increase in its stock price.

Binance reported $24.2B inflows in 2024, driven by 250 million users and institutional capital. Bybit and OKX followed with $8.2B and $5.3B, respectively.
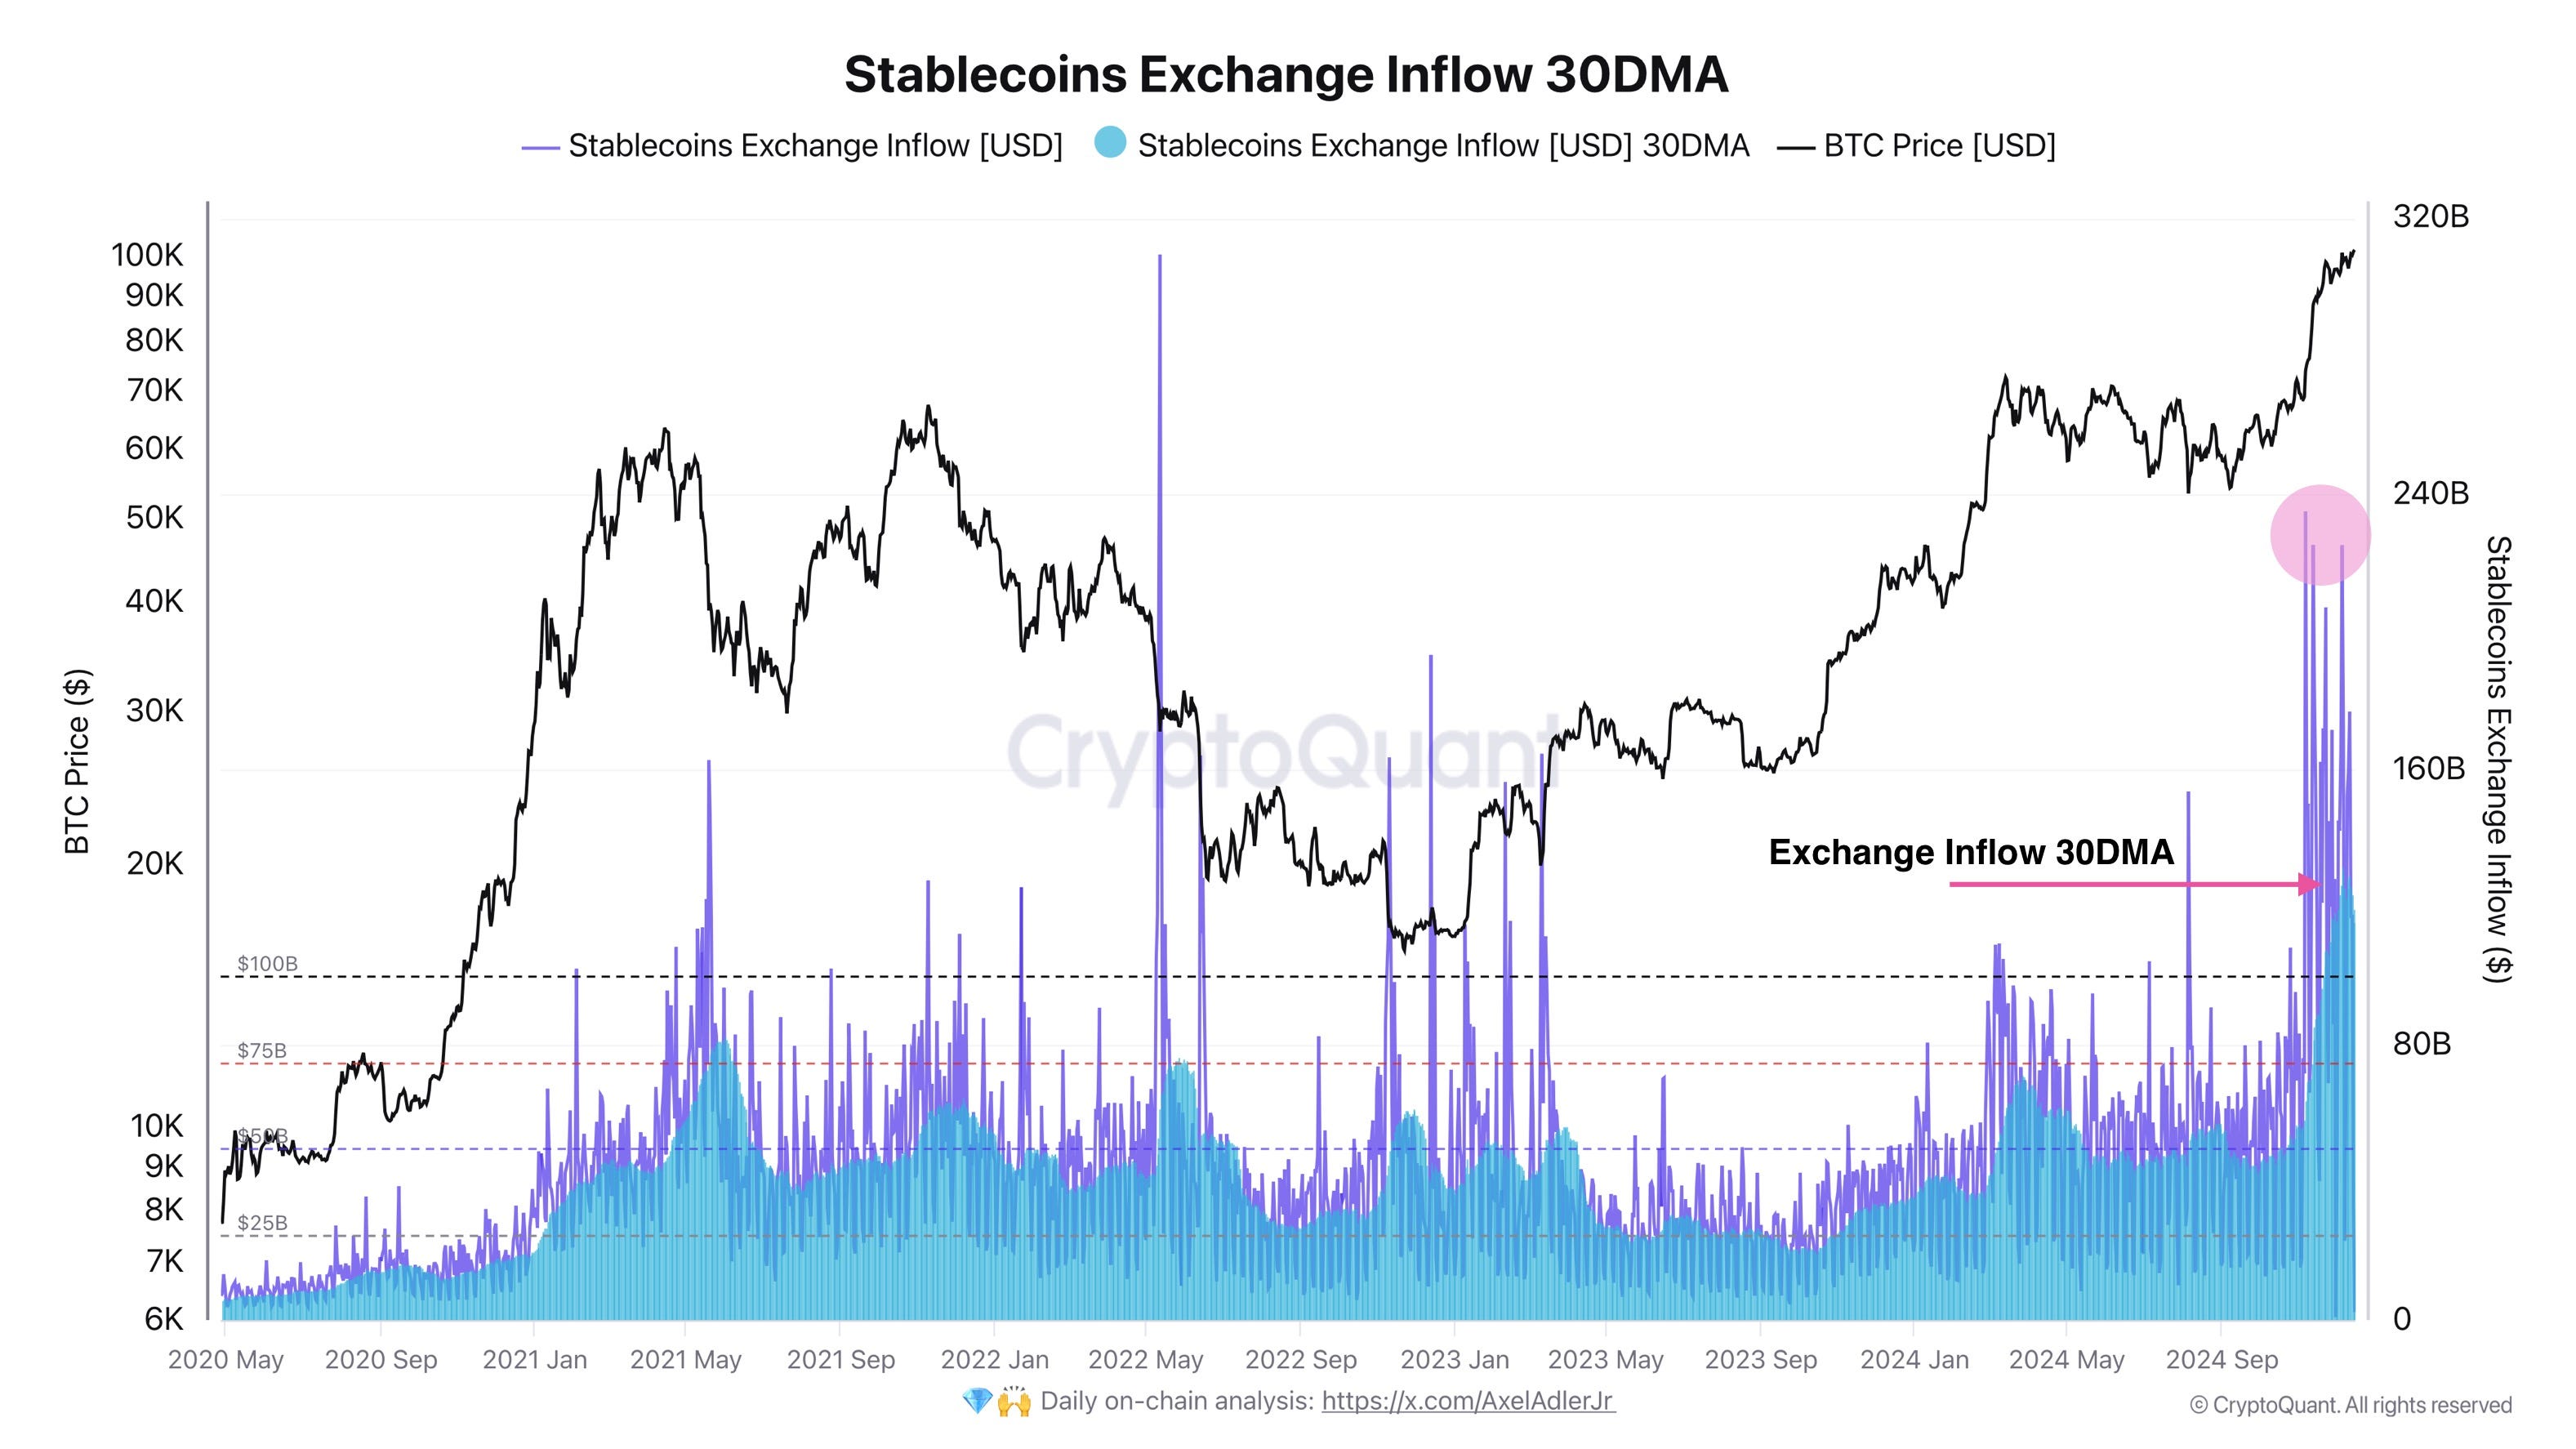
The market cap of stablecoins surpassed $200 billion as DeFi lending yields reached 10–20%, attracting capital with returns significantly exceeding traditional finance rates. The inflow of stablecoins indirectly supports Bitcoin’s growth, as I have noted on X.
Weekly Results
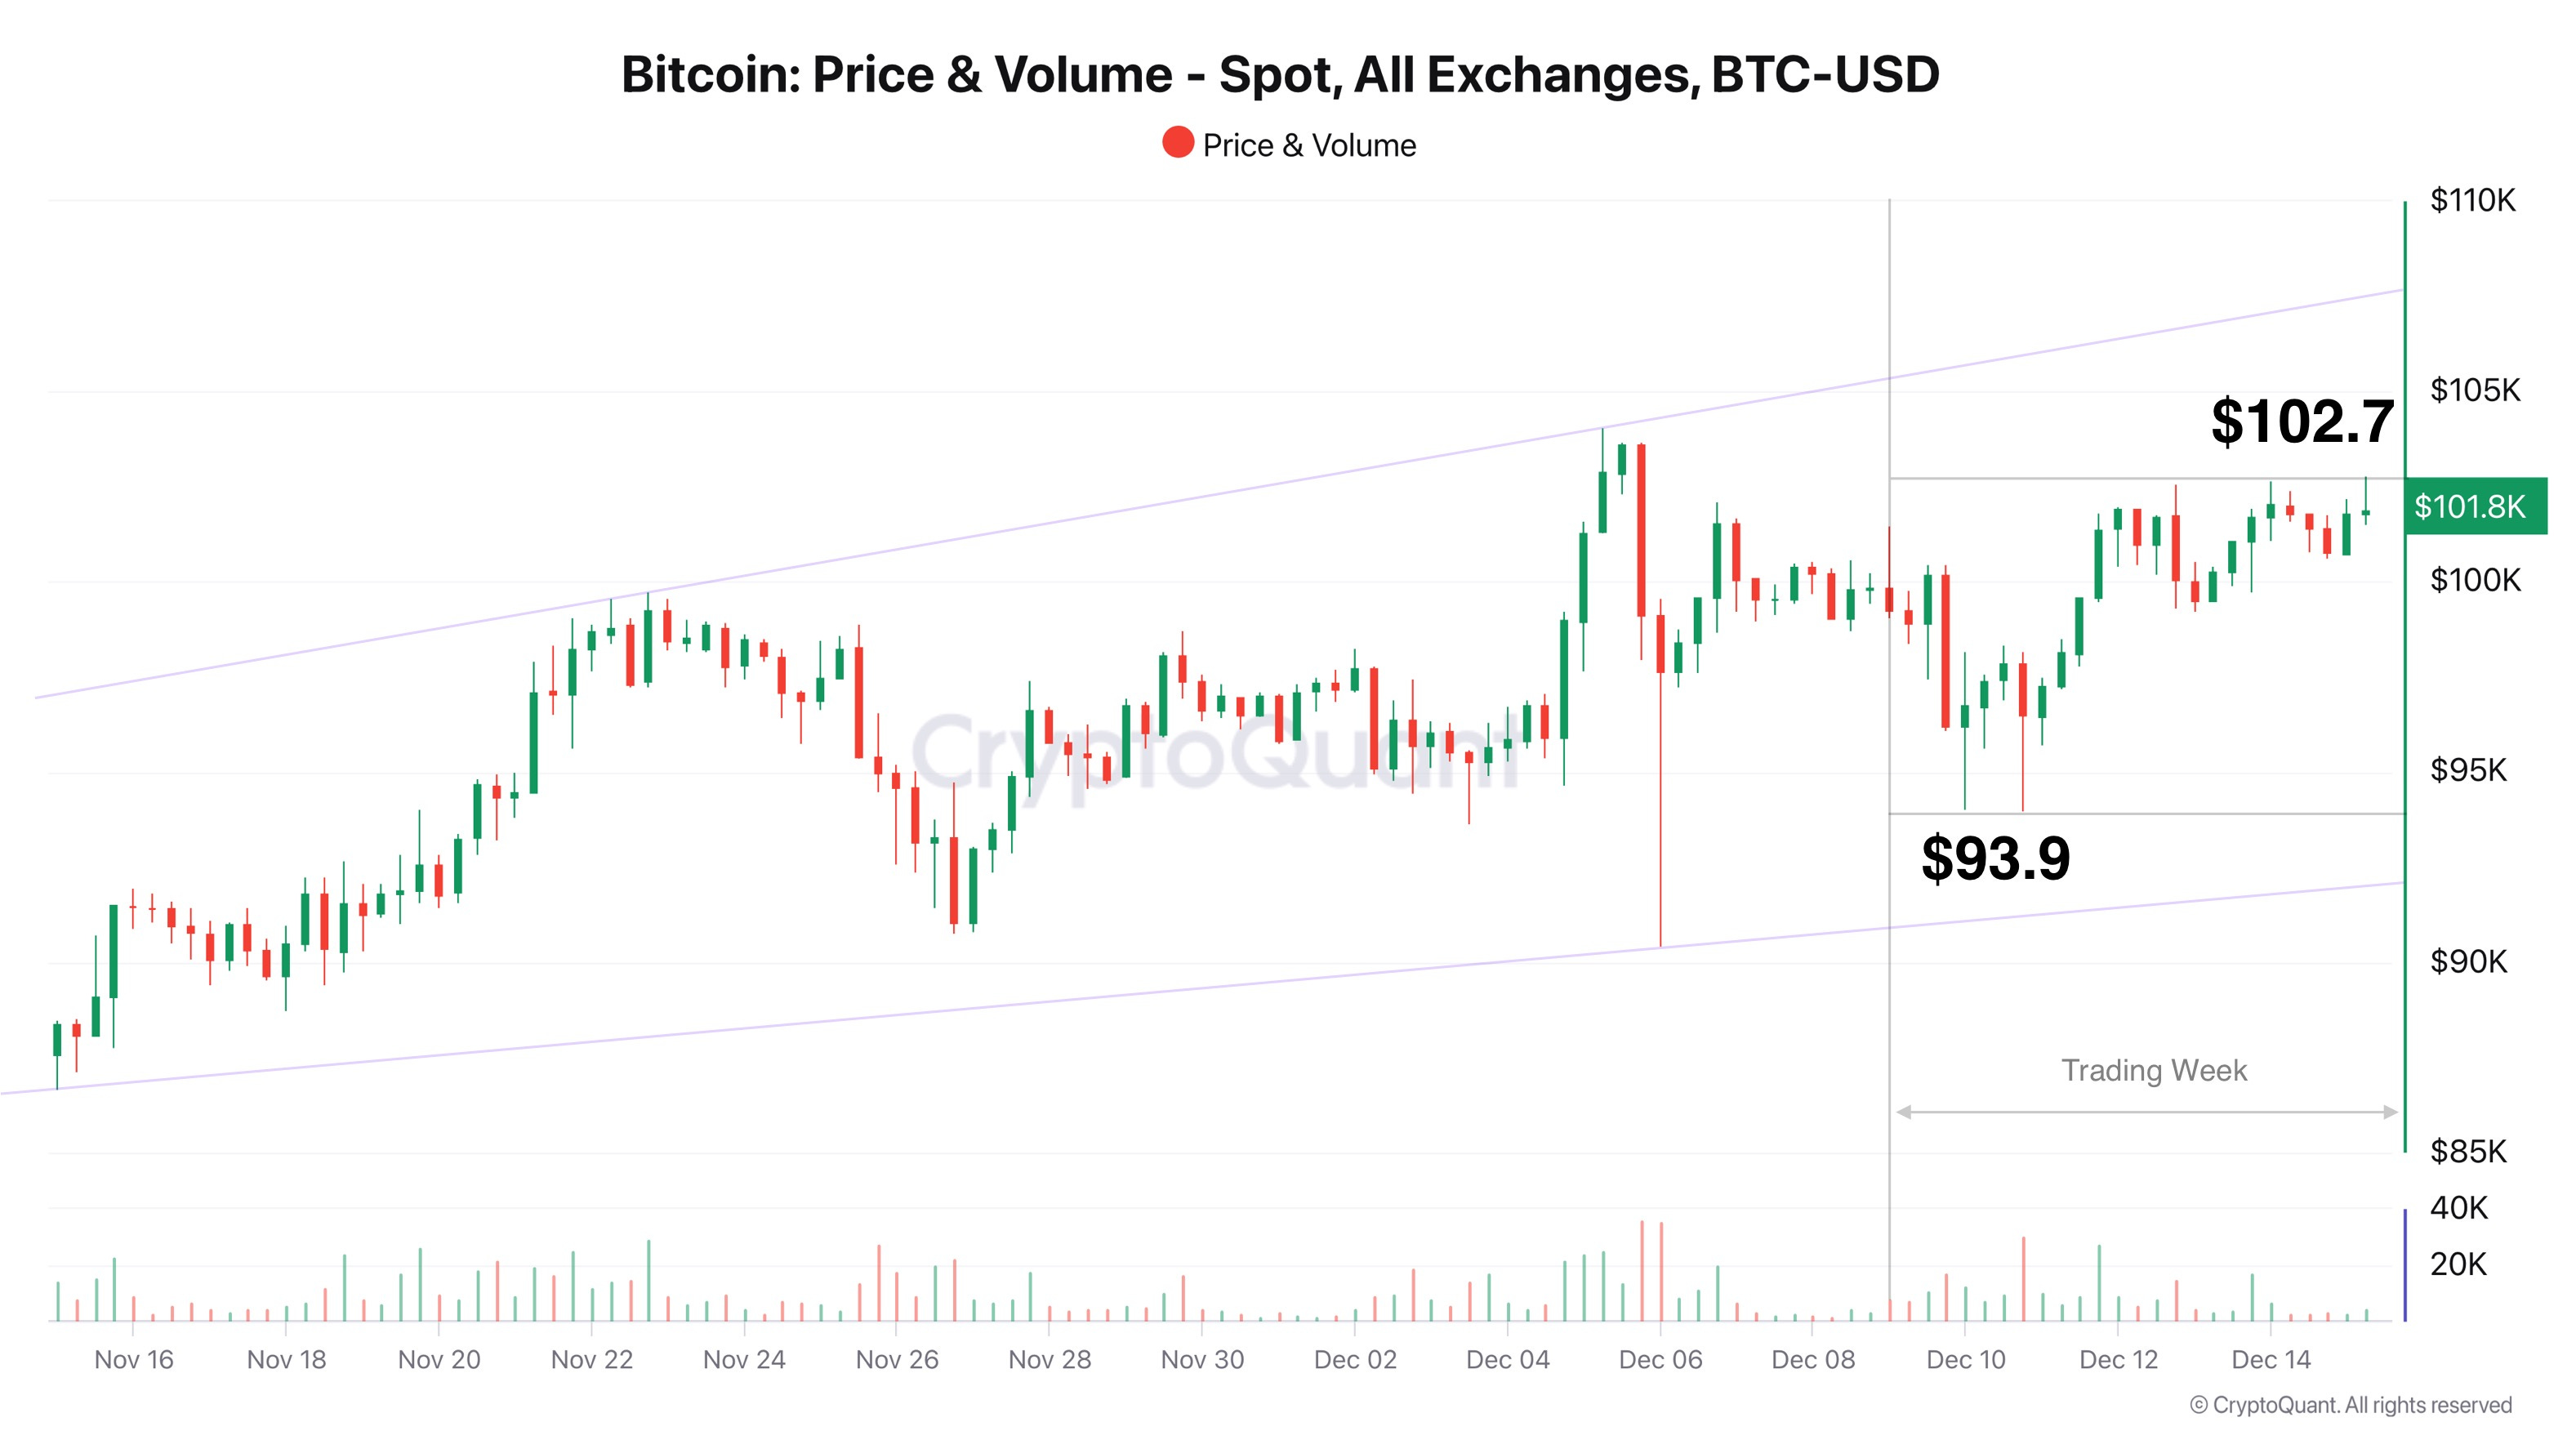
The weekly low was recorded at $93.9K, followed by a bullish impulse that pushed the price to a local high of $102.7K. The recovery was accompanied by moderate volume spikes, indicating active buying during local corrections.
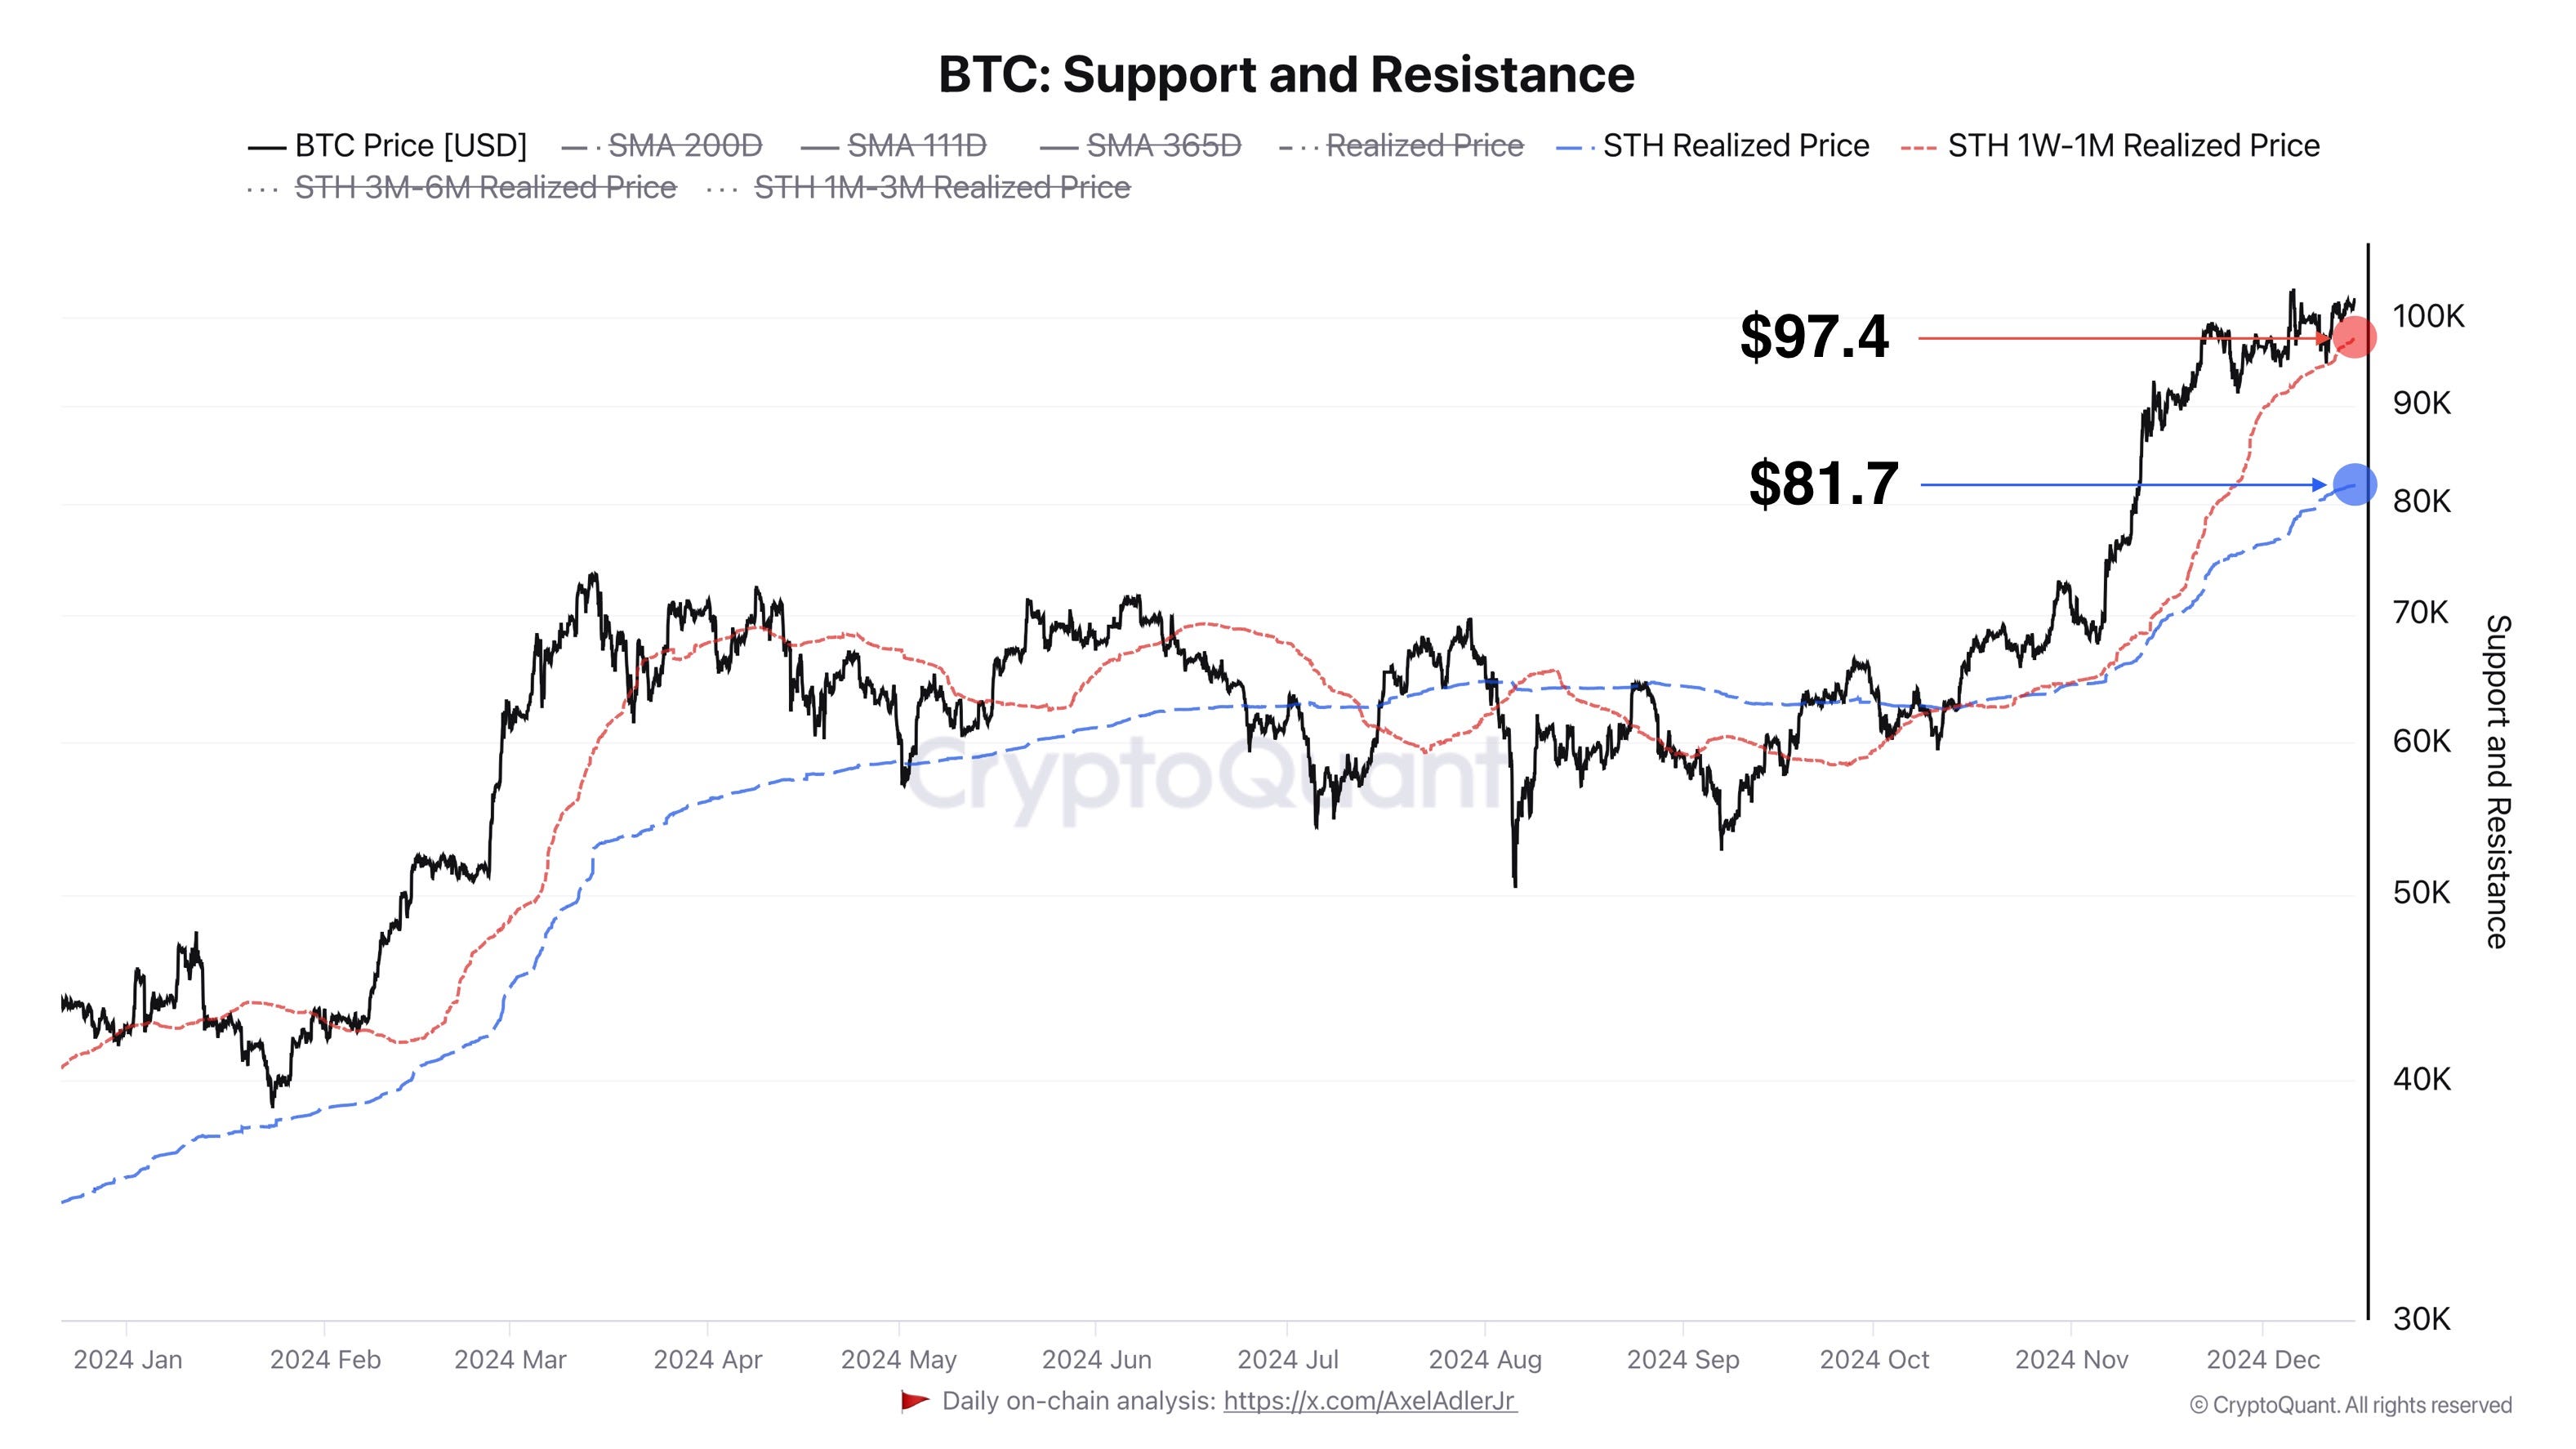
Key support levels at the end of the week are at $97.4K and $93K, while the baseline price for short-term holders remains at $81.7K.
My forecast: I expect the Fed to cut the interest rate by 25 basis points on December 18th. This decision could act as a catalyst for Bitcoin’s next growth phase, strengthening market interest amid monetary easing.
BTC: Value Days Destroyed
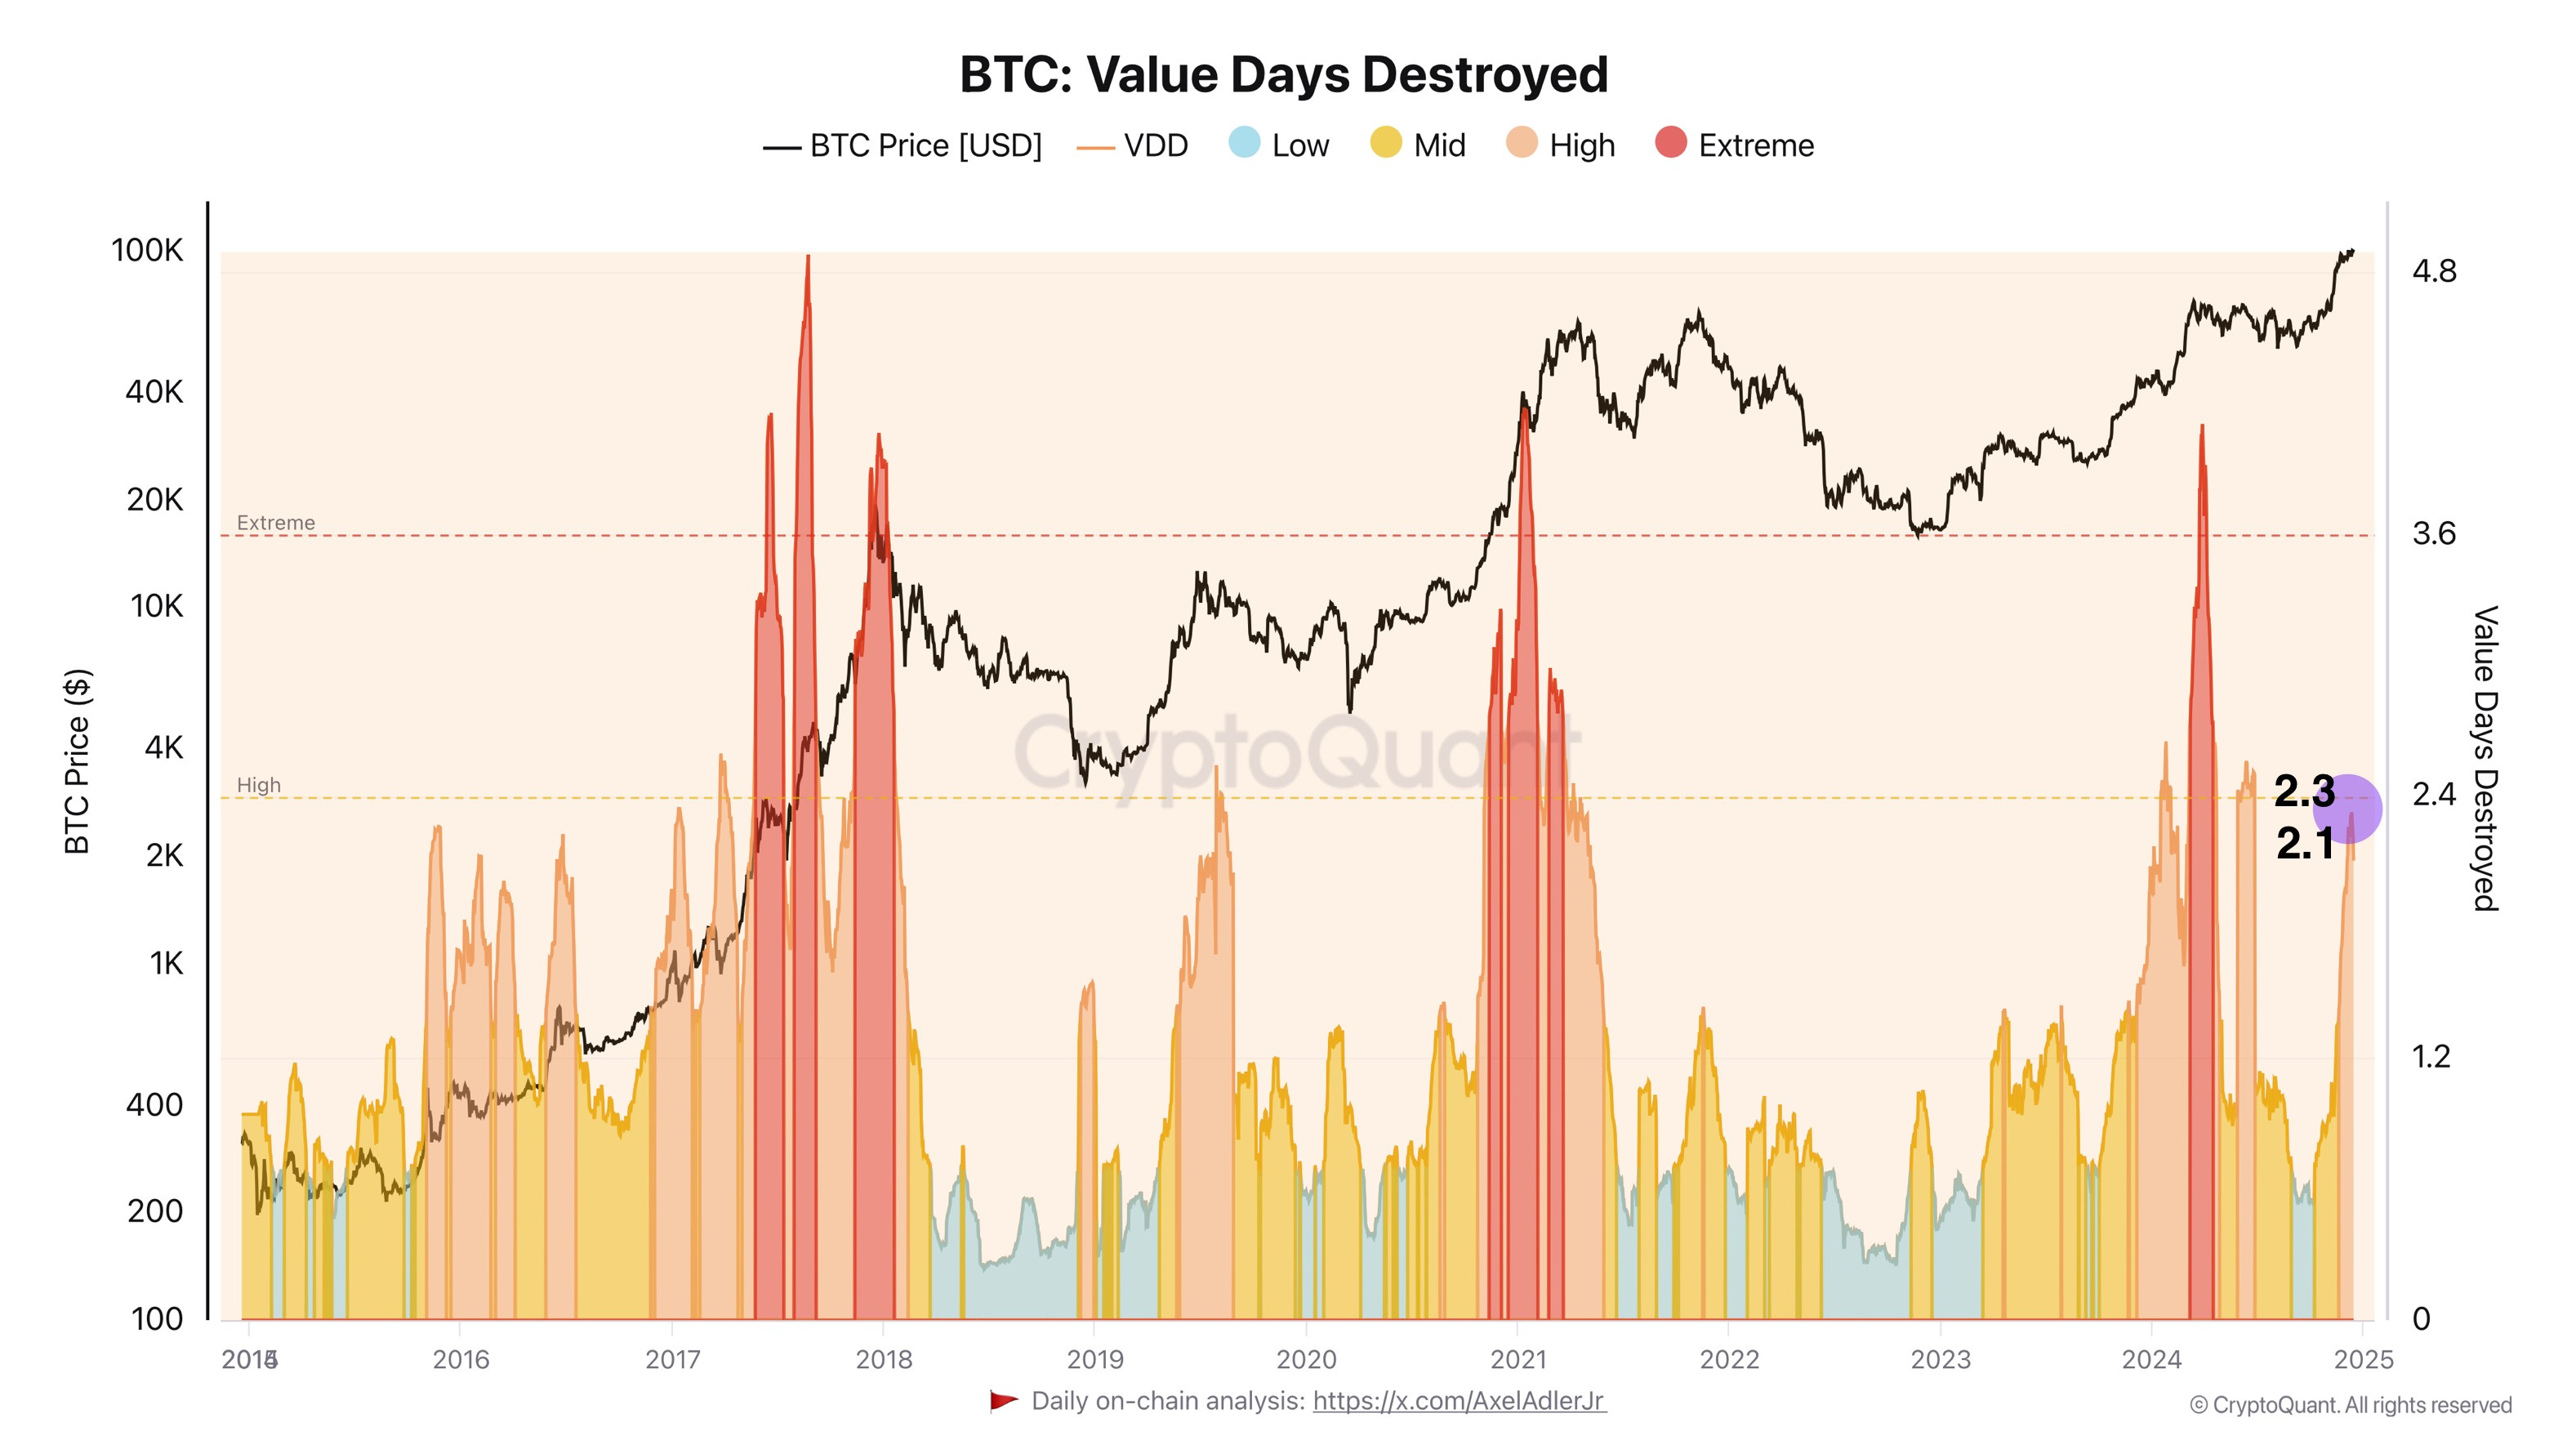
We begin today’s market overview with the Value Days Destroyed (VDD) metric, an extended version of Coin Days Destroyed (CDD). It factors in both the number of days coins were held and the current BTC price to reflect their economic "value" when moved.
VDD highlights market activities involving significant BTC transfers, particularly from long-term holders (LTH). High VDD values indicate profit realization, while low values point to quiet accumulation periods.
A 2-point decline in this metric suggests reduced activity from LTHs. This is a positive signal for the market: reduced large BTC movements ease supply pressure and lower the risk of sell-offs. Although the decline is minimal, it hints that the peak of LTH profit-taking may have passed, meaning most willing sellers have exited the market.
BTC: 90-Day Market vs Realized Price Gradient Oscillator

The next metric is the 90-Day Market vs Realized Price Gradient Oscillator. It measures the difference between Bitcoin’s market price and its realized price over 90 days, identifying overbought or oversold conditions.
Current Situation: The gradient holds slightly above the baseline, indicating a bullish market sentiment. If it approaches +2 STDV (upper boundary), profit-taking and a potential correction may follow. The gradient’s positive trend suggests the current growth phase is ongoing.
For convenience, you can set an alert for this indicator on CryptoQuant [here].
BTC: 4-Year Sharpe Ratio (%, Rolling)

Let’s analyze Bitcoin’s Sharpe Ratio relative to U.S. risk-free bonds.
The Sharpe Ratio measures investment efficiency adjusted for risk, showing how much return investors receive per unit of volatility. Higher values indicate a better return-to-risk ratio. However, extreme values may signal market **overheating** and unsustainable optimism, as seen when the ratio exceeded 10% in past market peaks.
Currently, Bitcoin’s Sharpe Ratio (purple line) is at 5.1%, meaning BTC outperformed the risk-free rate by 5.1% over the past 4 years, despite its volatility. This value underscores BTC’s appeal to high-risk investors.
If the Sharpe Ratio rises to 7%, it will indicate sustainable returns with moderate risk. Any further increase may signal overheating, similar to previous cycles.
Supplement to the Sharpe Ratio Report
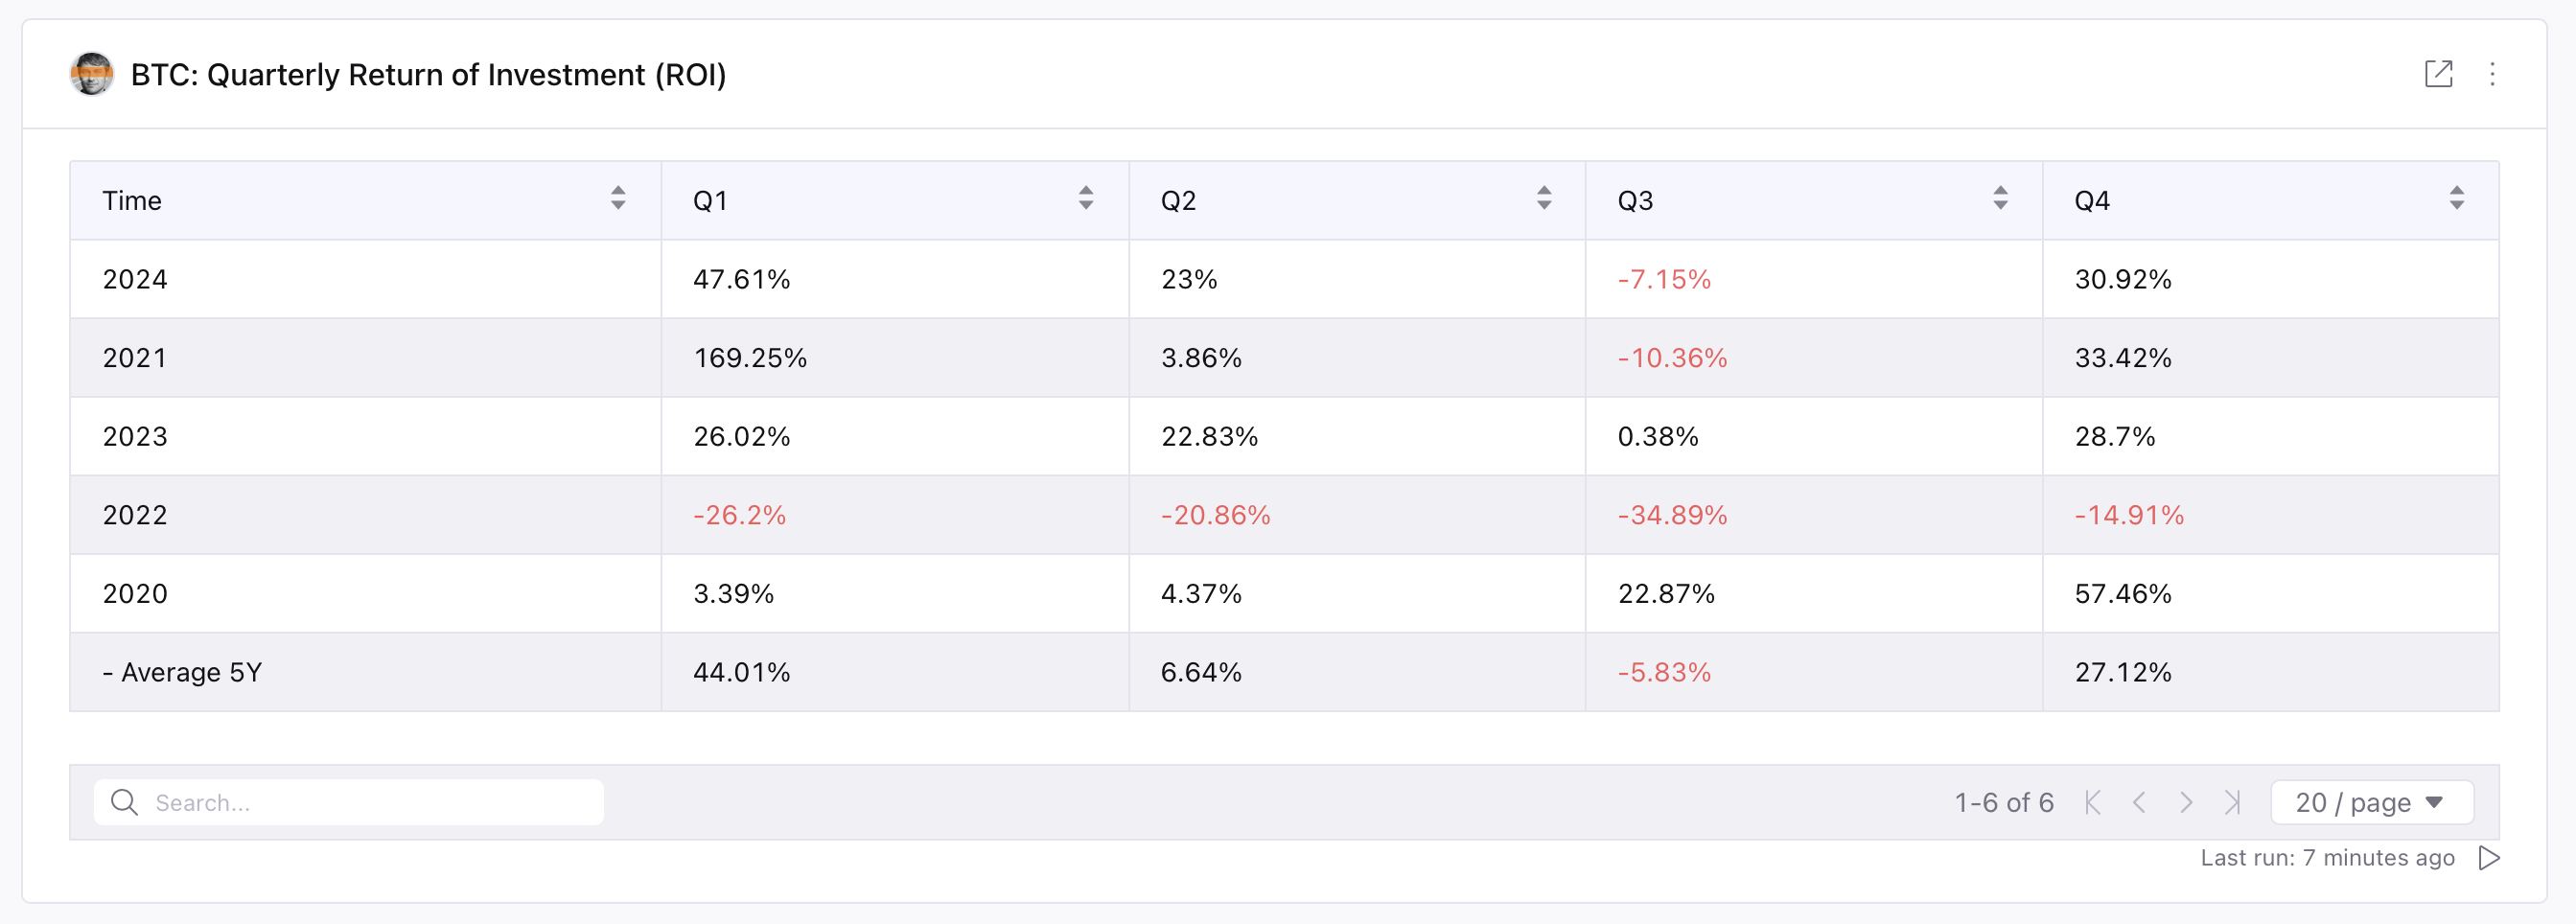
An analysis of Bitcoin’s quarterly return on investment (ROI) shows that the first quarter has historically been the strongest period for Bitcoin. The average ROI over the past 5 years stands at 44.01%, supported by significant gains in 2021 (+169.25%) and 2024 (+47.61%). The second and fourth quarters also show positive results, with growth of 6.64% and 27.12%, respectively, highlighting moderate seasonality.
Combined with the current Sharpe Ratio value of 5.1%, stable ROI in the fourth quarter points to moderate returns with an acceptable level of risk. If Q1/2025 follows this historical trend, we could see the Sharpe Ratio rise to 7%, reflecting sustainable market growth next year, aligning with Donald Trump’s policies and his administration’s stance toward Bitcoin.
BTC: MVRV Z-Score Standard Deviation Upper Bands
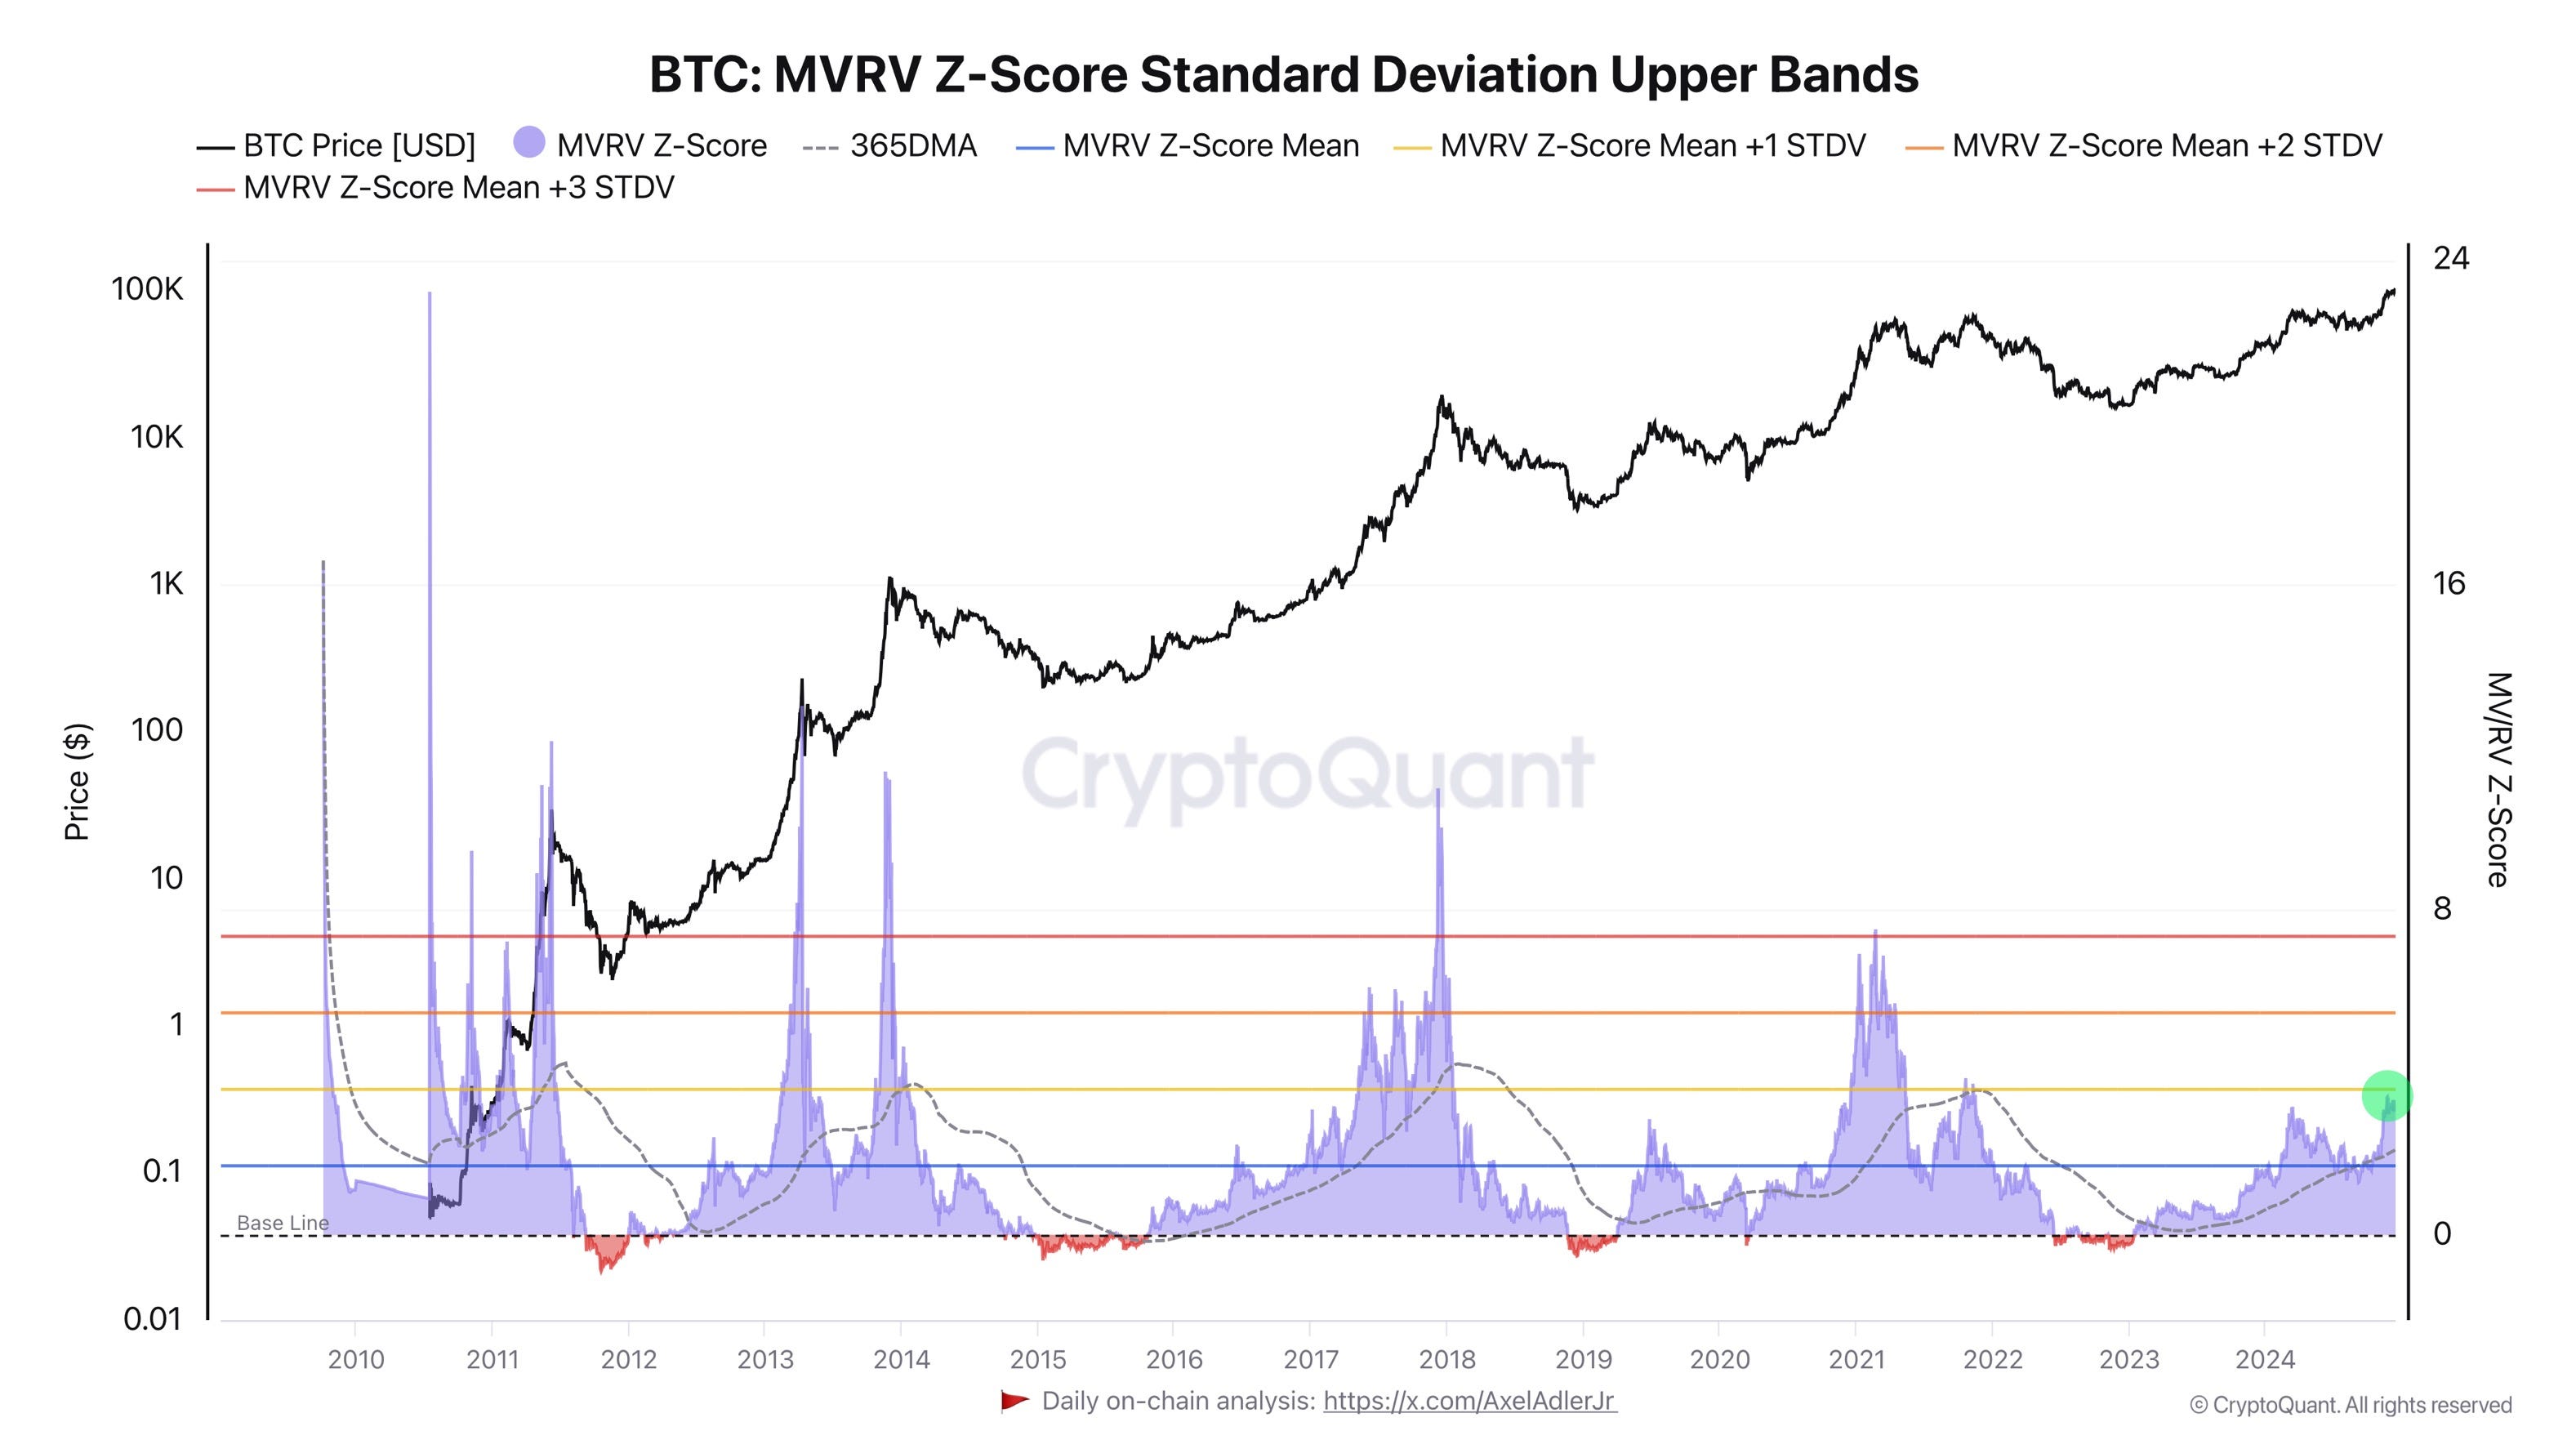
Finally, let’s assess the market structure via the MVRV Z-Score. Currently, the MVRV Z-Score (purple area) approaches 1 STDV (yellow line), indicating a moderately rising market valuation.
Historically, levels above 2–3 STDV (orange and red lines) have coincided with market peaks (e.g., 2013, 2017, and 2021). A sharp rise into this range would signal strong overvaluation and increase the likelihood of a correction.
Conclusions:
1. Market Structure: Key metrics like MVRV Z-Score and Value Days Destroyed suggest a healthy market phase, far from overheating.
2. Macro Drivers: Anticipated Fed rate cuts and Trump’s Bitcoin reserve plans are significant growth catalysts.
3. Institutional Activity: Large players, including MicroStrategy, MARA Holdings, and Riot Platforms, continue to accumulate BTC, bolstering long-term confidence.
4. Risk-Adjusted Returns: The current 5.1% Sharpe Ratio highlights Bitcoin’s strong risk-to-reward profile, with room for further growth.
5. Seasonality: Q1 remains the strongest quarter for BTC, historically averaging 44.01% ROI, aligning with ongoing market momentum.
Bitcoin’s market structure appears robust, supported by institutional interest, macroeconomic developments, and stable indicators. If key trends persist, BTC is positioned for further growth heading into 2025.
Good luck in the upcoming trading week!
AAJ
Nice one bro.
"Hi, does your Substack channel/newsletter require a subscription, or is it free?"