


Insight #25
Is a new bubble or massive growth on the horizon? In today's Insight, we analyze the bubble dynamics, demand and supply, network profitability, and the strategies of top companies.

Key Events of the Past Week:
The U.S. Internal Revenue Service (IRS) has finalized new tax reporting rules for cryptocurrency brokers. These rules require brokers, including exchanges and payment processors, to report information on their users' digital asset sales and exchanges to the IRS. Implementation will be phased: starting in 2025, brokers must report gross proceeds for 2025 using the new Form 1099-DA, and in 2026, they must provide acquisition cost data for transactions starting January 1, 2026. The new tax reporting requirements for cryptocurrencies will take effect in 2025, with reporting due in 2026, giving investors and brokers time to adapt to the new standards.
In Switzerland, a campaign has been launched to gather 100,000 signatures within 18 months for a referendum that would require the Swiss National Bank (SNB) to hold part of its reserves in Bitcoin and gold.
El Salvador has increased its Bitcoin reserves to 6,000 BTC, equivalent to $589 million. This strategy, spearheaded by President Nayib Bukele, has led to a 108% return on investment, with an average purchase price of approximately $45,450 per Bitcoin.
MicroStrategy plans to raise $2 billion through preferred shares in Q1 2025 to expand its "21/21 plan" for large-scale Bitcoin purchases. Previously, MicroStrategy acquired 2,138 BTC for $209 million, increasing its holdings to 446,400 BTC at an average price of $62,428, funded through stock sales. Additionally, Michael Saylor announced on Fox News that he plans to destroy his BTC keys upon his death, ensuring no one can ever sell his Bitcoin.
However, after the New Year, the BlackRock spot Bitcoin ETF experienced a record daily outflow of $332.6 million, while total net outflows from U.S. spot Bitcoin ETFs reached $242.3 million.
Tether's USDT market capitalization fell 1.2% to $137 billion after the EU's MiCA regulations came into full effect. Despite the negativity, Tether transferred 7,629 BTC ($700 million) to its Bitcoin reserves, increasing its holdings to over 82,000 BTC as part of diversification efforts.
Summary:
New tax reporting requirements for crypto brokers in the U.S. are set to enhance transparency and may increase traditional investors' trust in digital assets. Meanwhile, Switzerland debates legislation to hold national bank reserves in Bitcoin and gold, and El Salvador continues accumulating BTC, indicating further market institutionalization.
Large companies like MicroStrategy remain committed to massive Bitcoin acquisitions, attracting substantial funds for long-term strategies. Record inflows through ETFs are counterbalanced by significant outflows at the start of the year, signaling potential short-term volatility. Amid tighter EU regulations and declining USDT capitalization, Tether diversifies its reserves by increasing its Bitcoin holdings.
Weekly Summary:
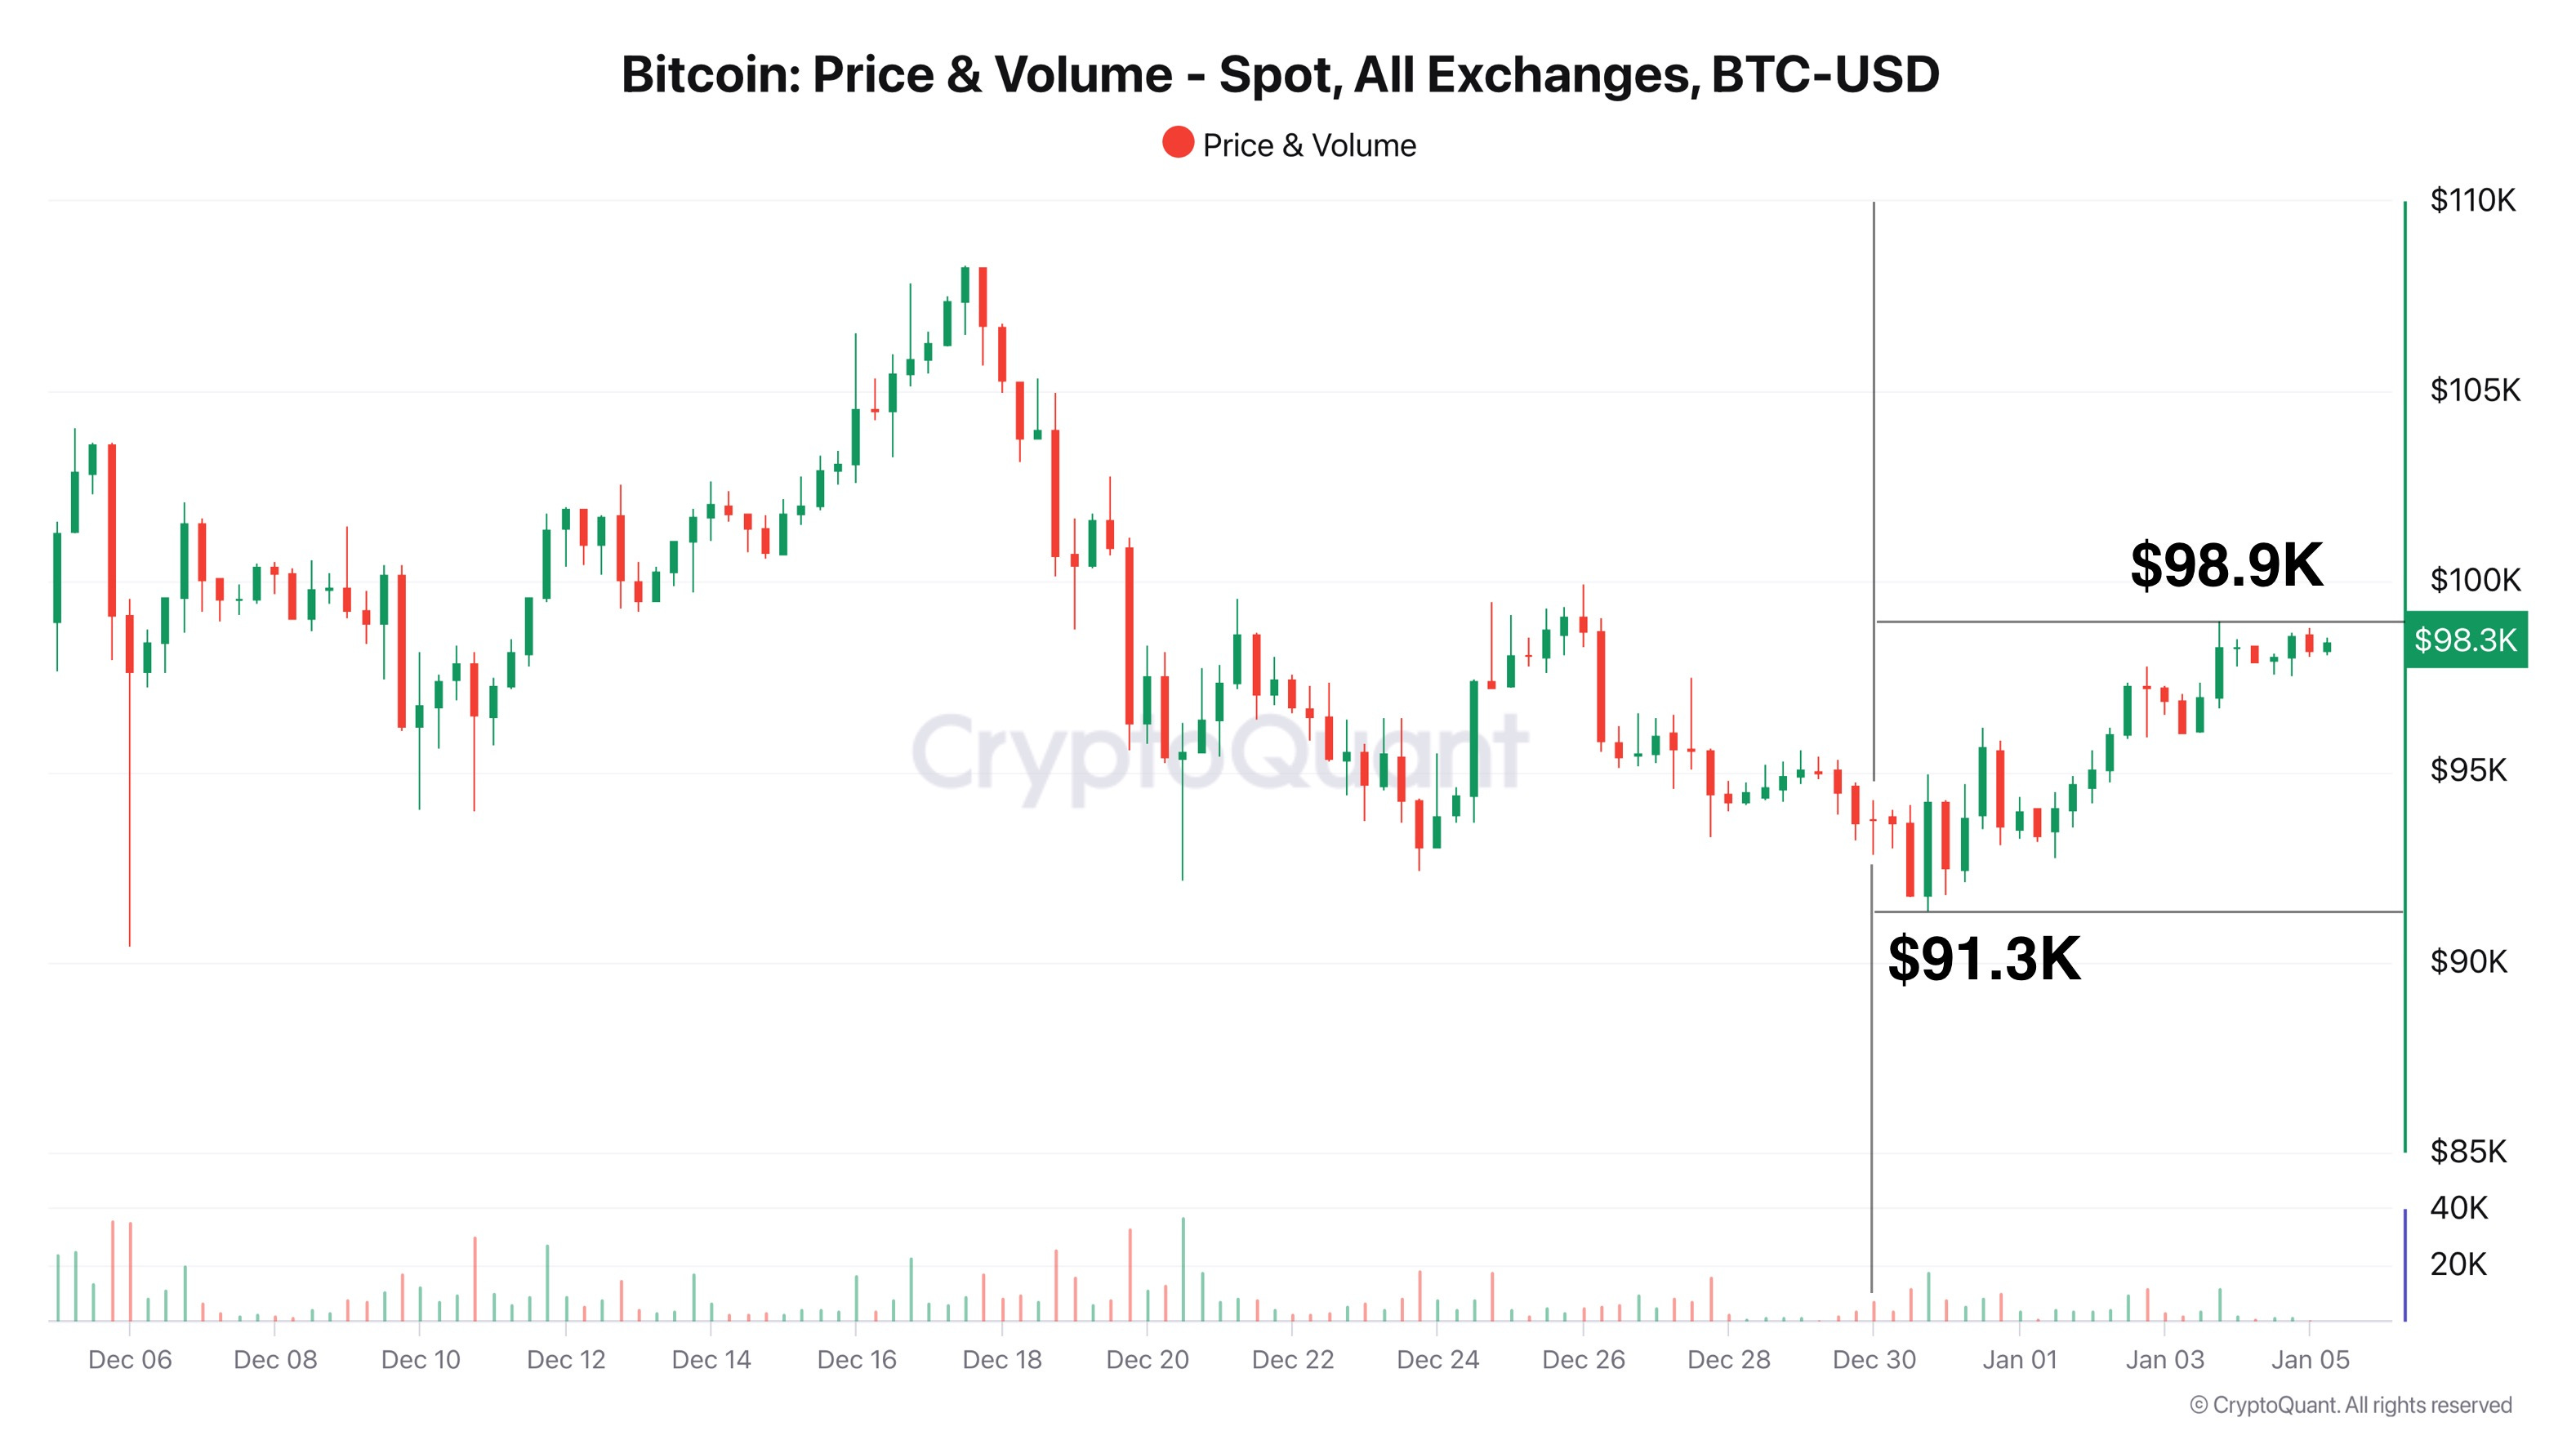
Spot markets during the holiday period showed a micro bullish trend. Prices fluctuated between $91,300 and $98,900. The chart also reveals reduced trading activity, typical during the New Year holidays.
Potential Resistance and Support Levels:
- Resistance: $98,900
- Support: $91,300
When prices "range" within a narrow band and trading volumes decline, it usually reflects waning interest in the asset and a lack of decisive action from market participants. Few new trades occur, and the price lacks sufficient volume for a major breakout or a deep pullback. This could be a pause as the market awaits a new trigger (e.g., news, macro data). Essentially, this is the New Year's lull in full swing, with declining volumes and price consolidation signaling a temporary calm before the next move.
Let's Start with Analysts' Bitcoin Price Predictions for 2025:
Bitwise: Analysts predict Bitcoin could exceed $200,000 by 2025. If the U.S. government adopts a strategic Bitcoin reserve plan, the price could reach $500,000.
Standard Chartered: Experts anticipate Bitcoin hitting $125,000 by late 2024 and $200,000 by 2025, supported by expected political backing under a Trump administration.
VanEck: Predicts Bitcoin could peak at $180,000 in 2025 but warns of potential 30% corrections following new highs.
Deepwater Asset Management: Analysts project Bitcoin reaching $150,000 in 2025, driven by favorable market and regulatory conditions.
MarketWatch: Analyst John Glover forecasts Bitcoin surpassing $125,000 in Q1 2025, especially with crypto industry support from a Trump administration, but warns of a potential drop to $77,000 in the absence of such support.
Investors.com: Analysts at H.C. Wainwright predict Bitcoin reaching $225,000 by late 2025, citing historical price cycles and increased institutional adoption.
Barron's: Alex Thorn of Galaxy Digital projects Bitcoin could exceed $150,000 in H1 2025 and reach $185,000 by year-end, driven by growing institutional and governmental adoption.
My Target for 2025: $155,000 - achieving this would secure a 10x profit cycle for my readers. Future market dynamics will depend on metrics and actual supply-demand conditions at these levels. A lack of demand could prompt a correction, possibly exceeding VanEck's forecasted 30% pullback.
Unlike other analysts, we have over 1,000 models providing insights that surpass traditional analysis, forming the basis for the Insight you're reading.
Bitcoin: Bubble vs. Crash Market Structure
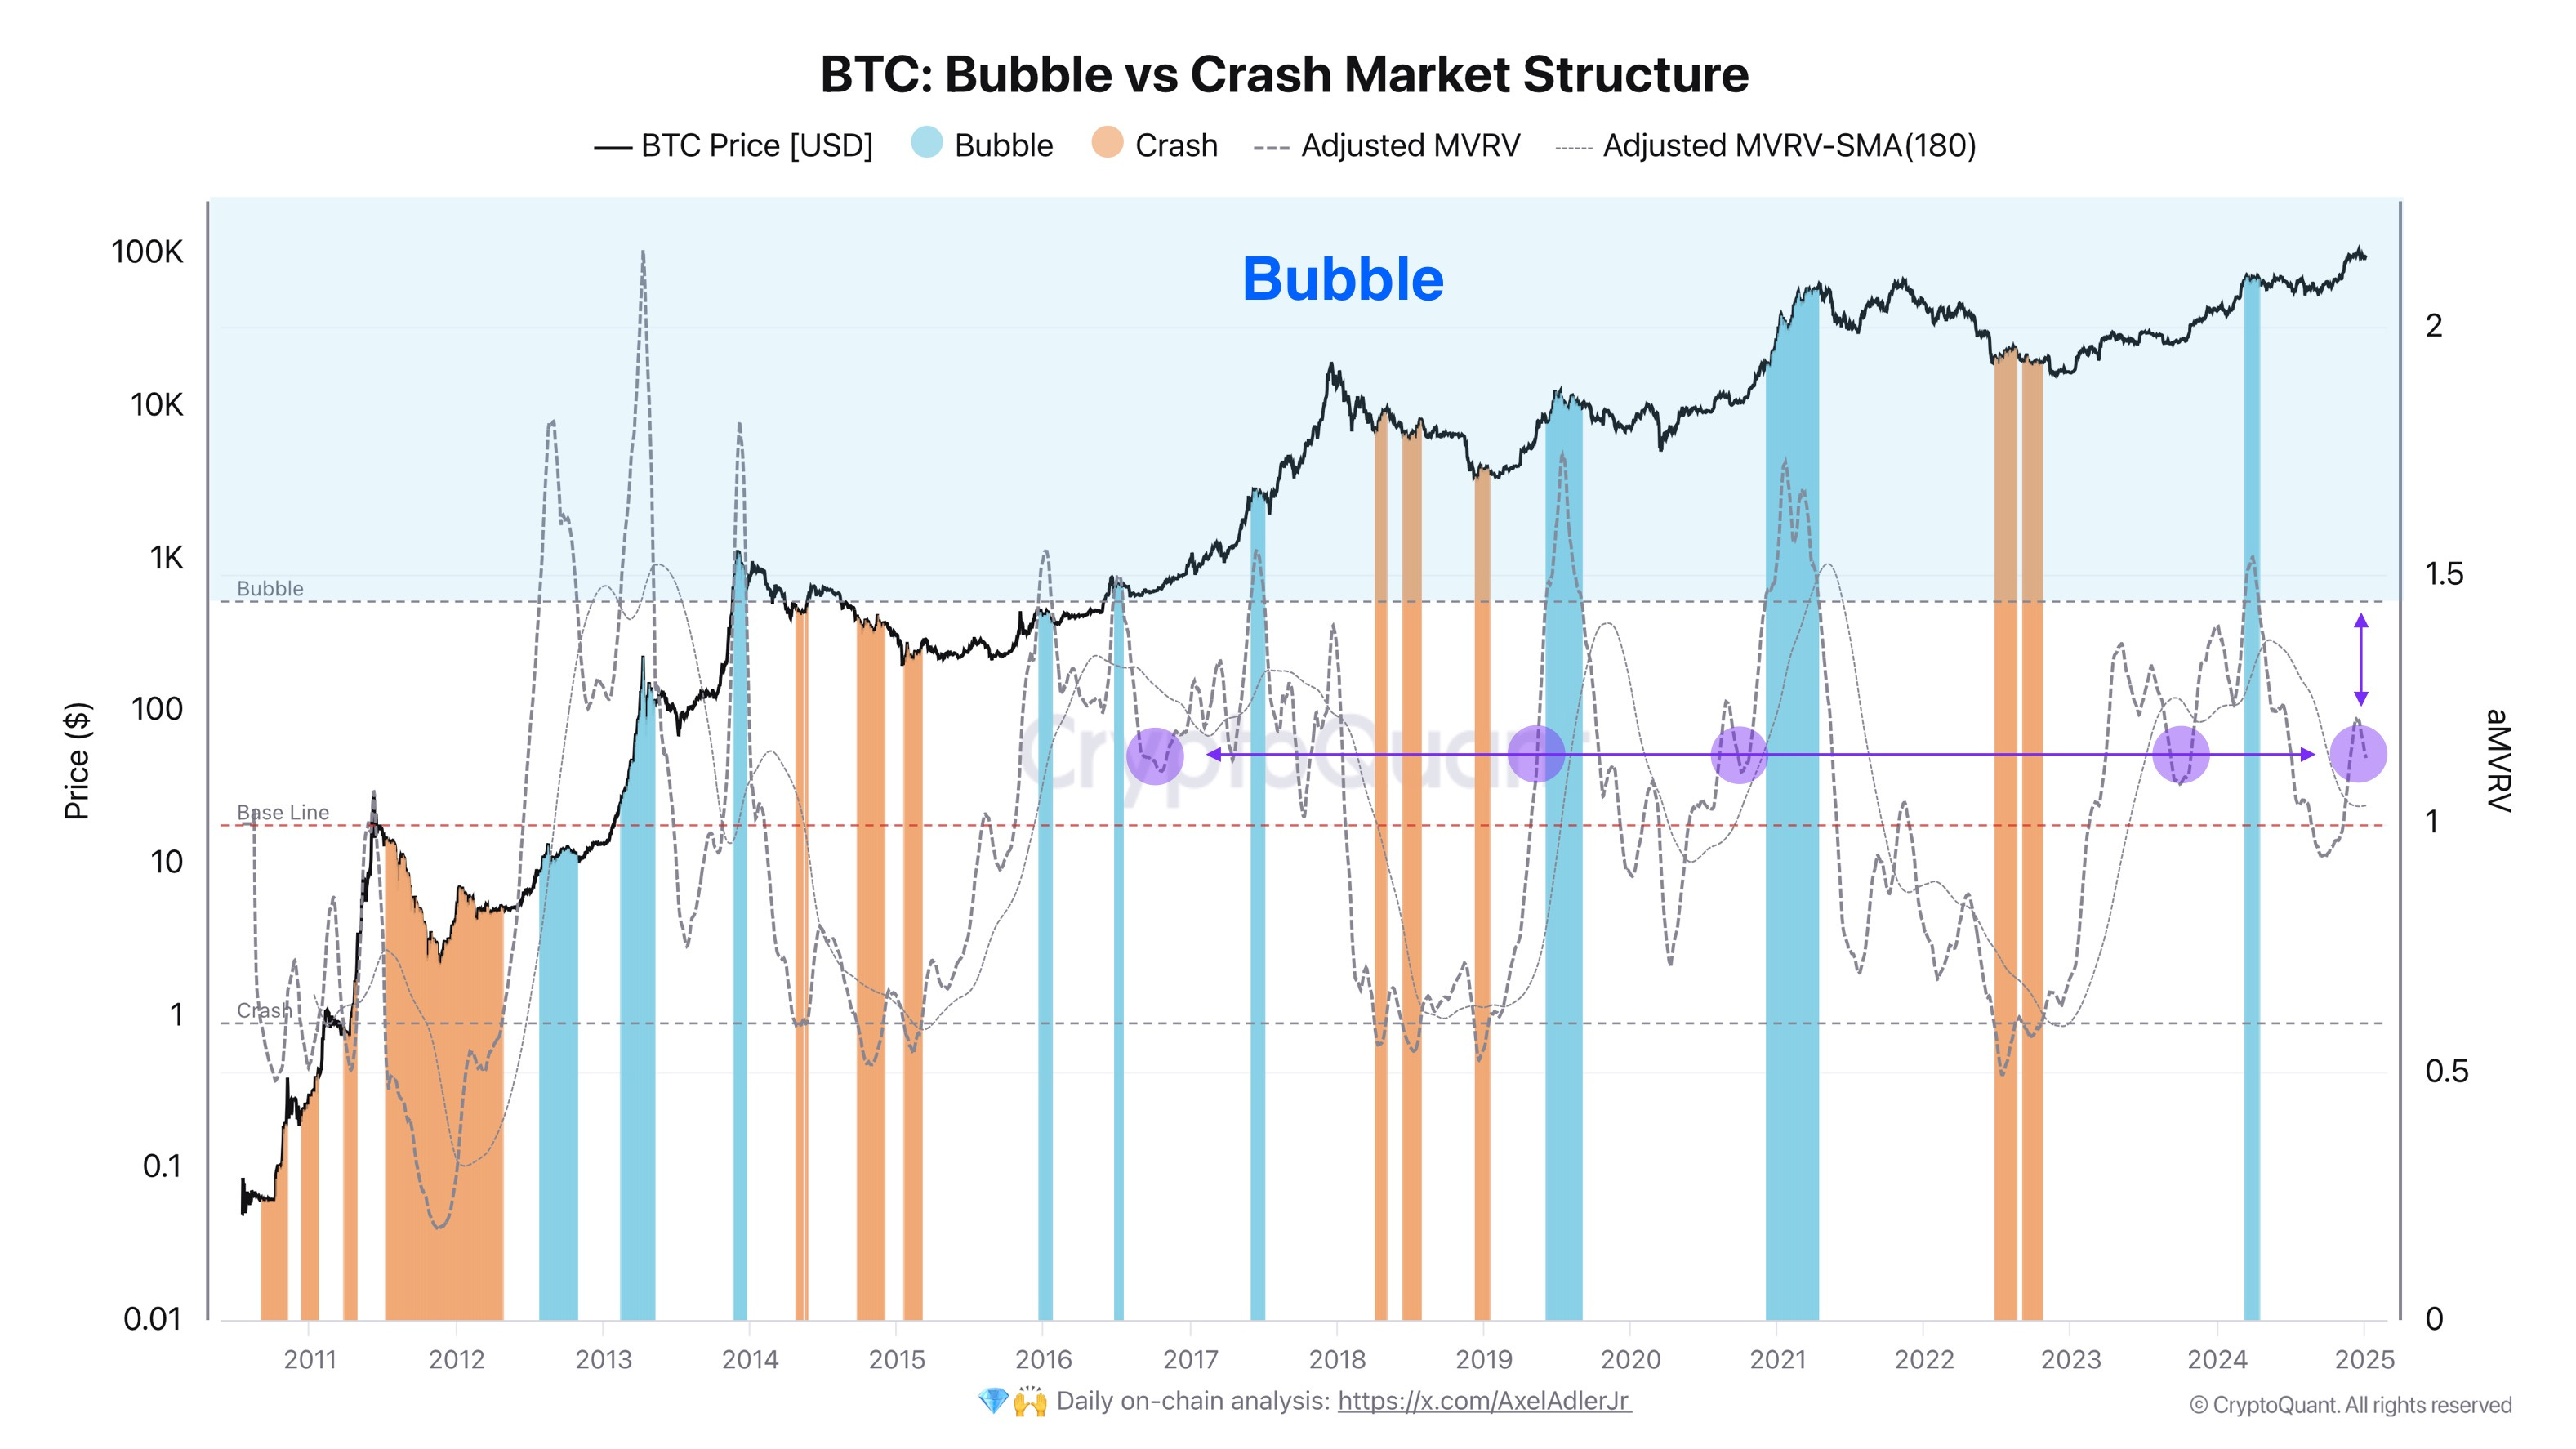
Let's start by checking whether the market is currently in a bubble. Based on the current values (purple circles) and a comparison with previous "bubbles" (areas where MVRV spiked sharply above ≈1,5), we appear to be far from "overheated" levels.
The last bubble in this cycle occurred at $70,000, followed by a natural market cooldown (a decline in both price and MVRV).
Historically, MVRV levels around ≈1–1.3 often indicate what is referred to as a "fair" or moderate market valuation. If the metric rises significantly above 1,5, the likelihood of a bubble increases. Conversely, when it falls below 1, the market is often oversold and/or ready for a recovery phase, as is evident during prolonged bear markets.
The chart also includes a dashed line representing the 180-day moving average (SMA) for MVRV. This helps track the trend with less noise. When the current Adjusted MVRV is above the 180 SMA, it typically signals a positive (bullish) trend. If it remains below the 180 SMA for an extended period, it indicates market weakening. The current position suggests that the market is in a "recovery" phase rather than an "overheated" state.
Bitcoin: Demand Momentum*
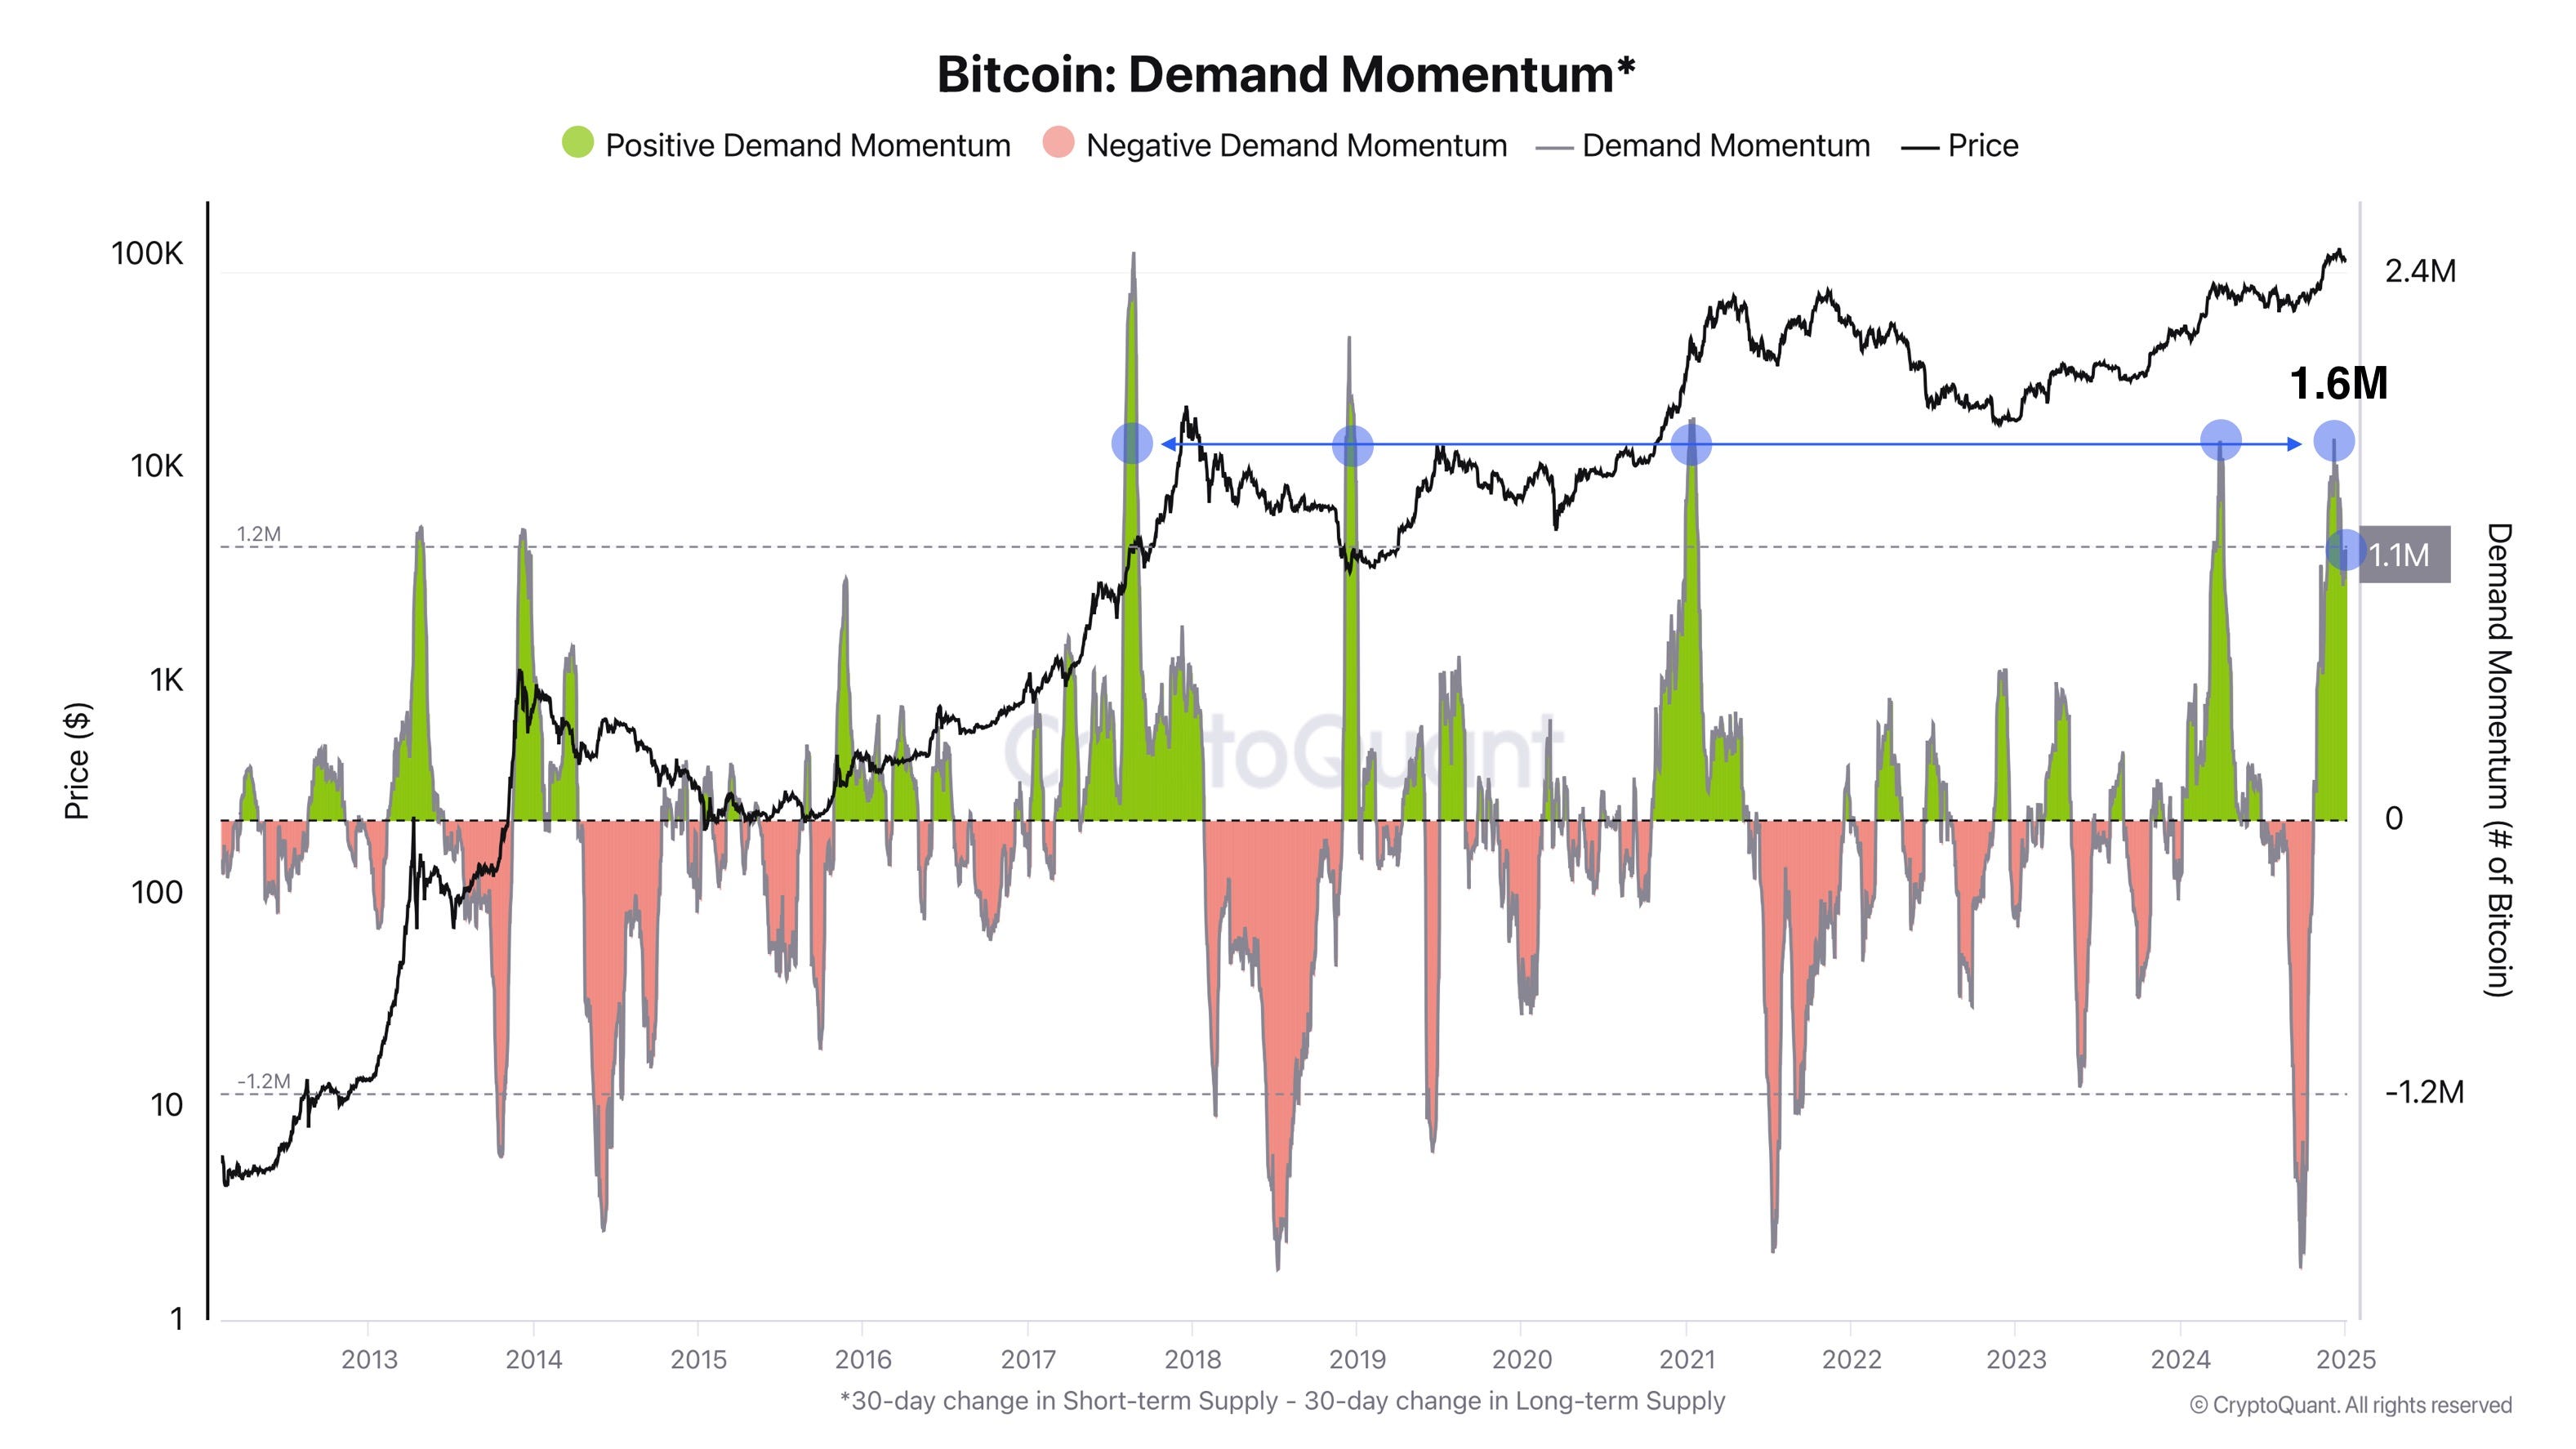
This model was created by Head of Research at CryptoQuant, Julio Moreno.
Now, let’s take a closer look at how strong the market demand for coins is.
The chart illustrates the difference between the inflow of coins to short-term holders (STH) and the growth (or reduction) in long-term supply. In other words, if short-term holders are actively buying/accumulating coins while long-term holders are not significantly increasing their sales, we see a "green" (positive) spike. Conversely, when long-term holders accumulate faster than short-term demand grows, or when short-term holders begin selling en masse, the metric shifts into the "red" zone (negative Demand Momentum).
In the current cycle, Demand Momentum peaked at $70K and $100K, with readings of 1.6M BTC. At present, demand has decreased to approximately +1.1M BTC, which is still close to the “peak” levels observed during strong bullish trends. This indicates that the net demand for coins remains relatively high — there is a significant influx of coins among the STH cohort, with relatively low coin outflows from long-term holders.
Historical parallels: Spikes above approximately +1.2M BTC have frequently coincided with periods of rapid BTC price growth. However, after extreme levels (above +1.2M), corrections or at least slower growth rates have often followed. Deep "red" dips have typically signaled the capitulation of short-term investors and aggressive accumulation by long-term holders.
Currently, according to Demand Momentum, there is substantial demand in the market, comparable to previous significant surges. While the market has already experienced “overheated” conditions at extreme levels, it is now in a cooling phase. Nevertheless, the metric remains elevated. How long we stay at these levels remains to be seen. For now, let’s move on to the next data points.
Bitcoin Average Profitability Index
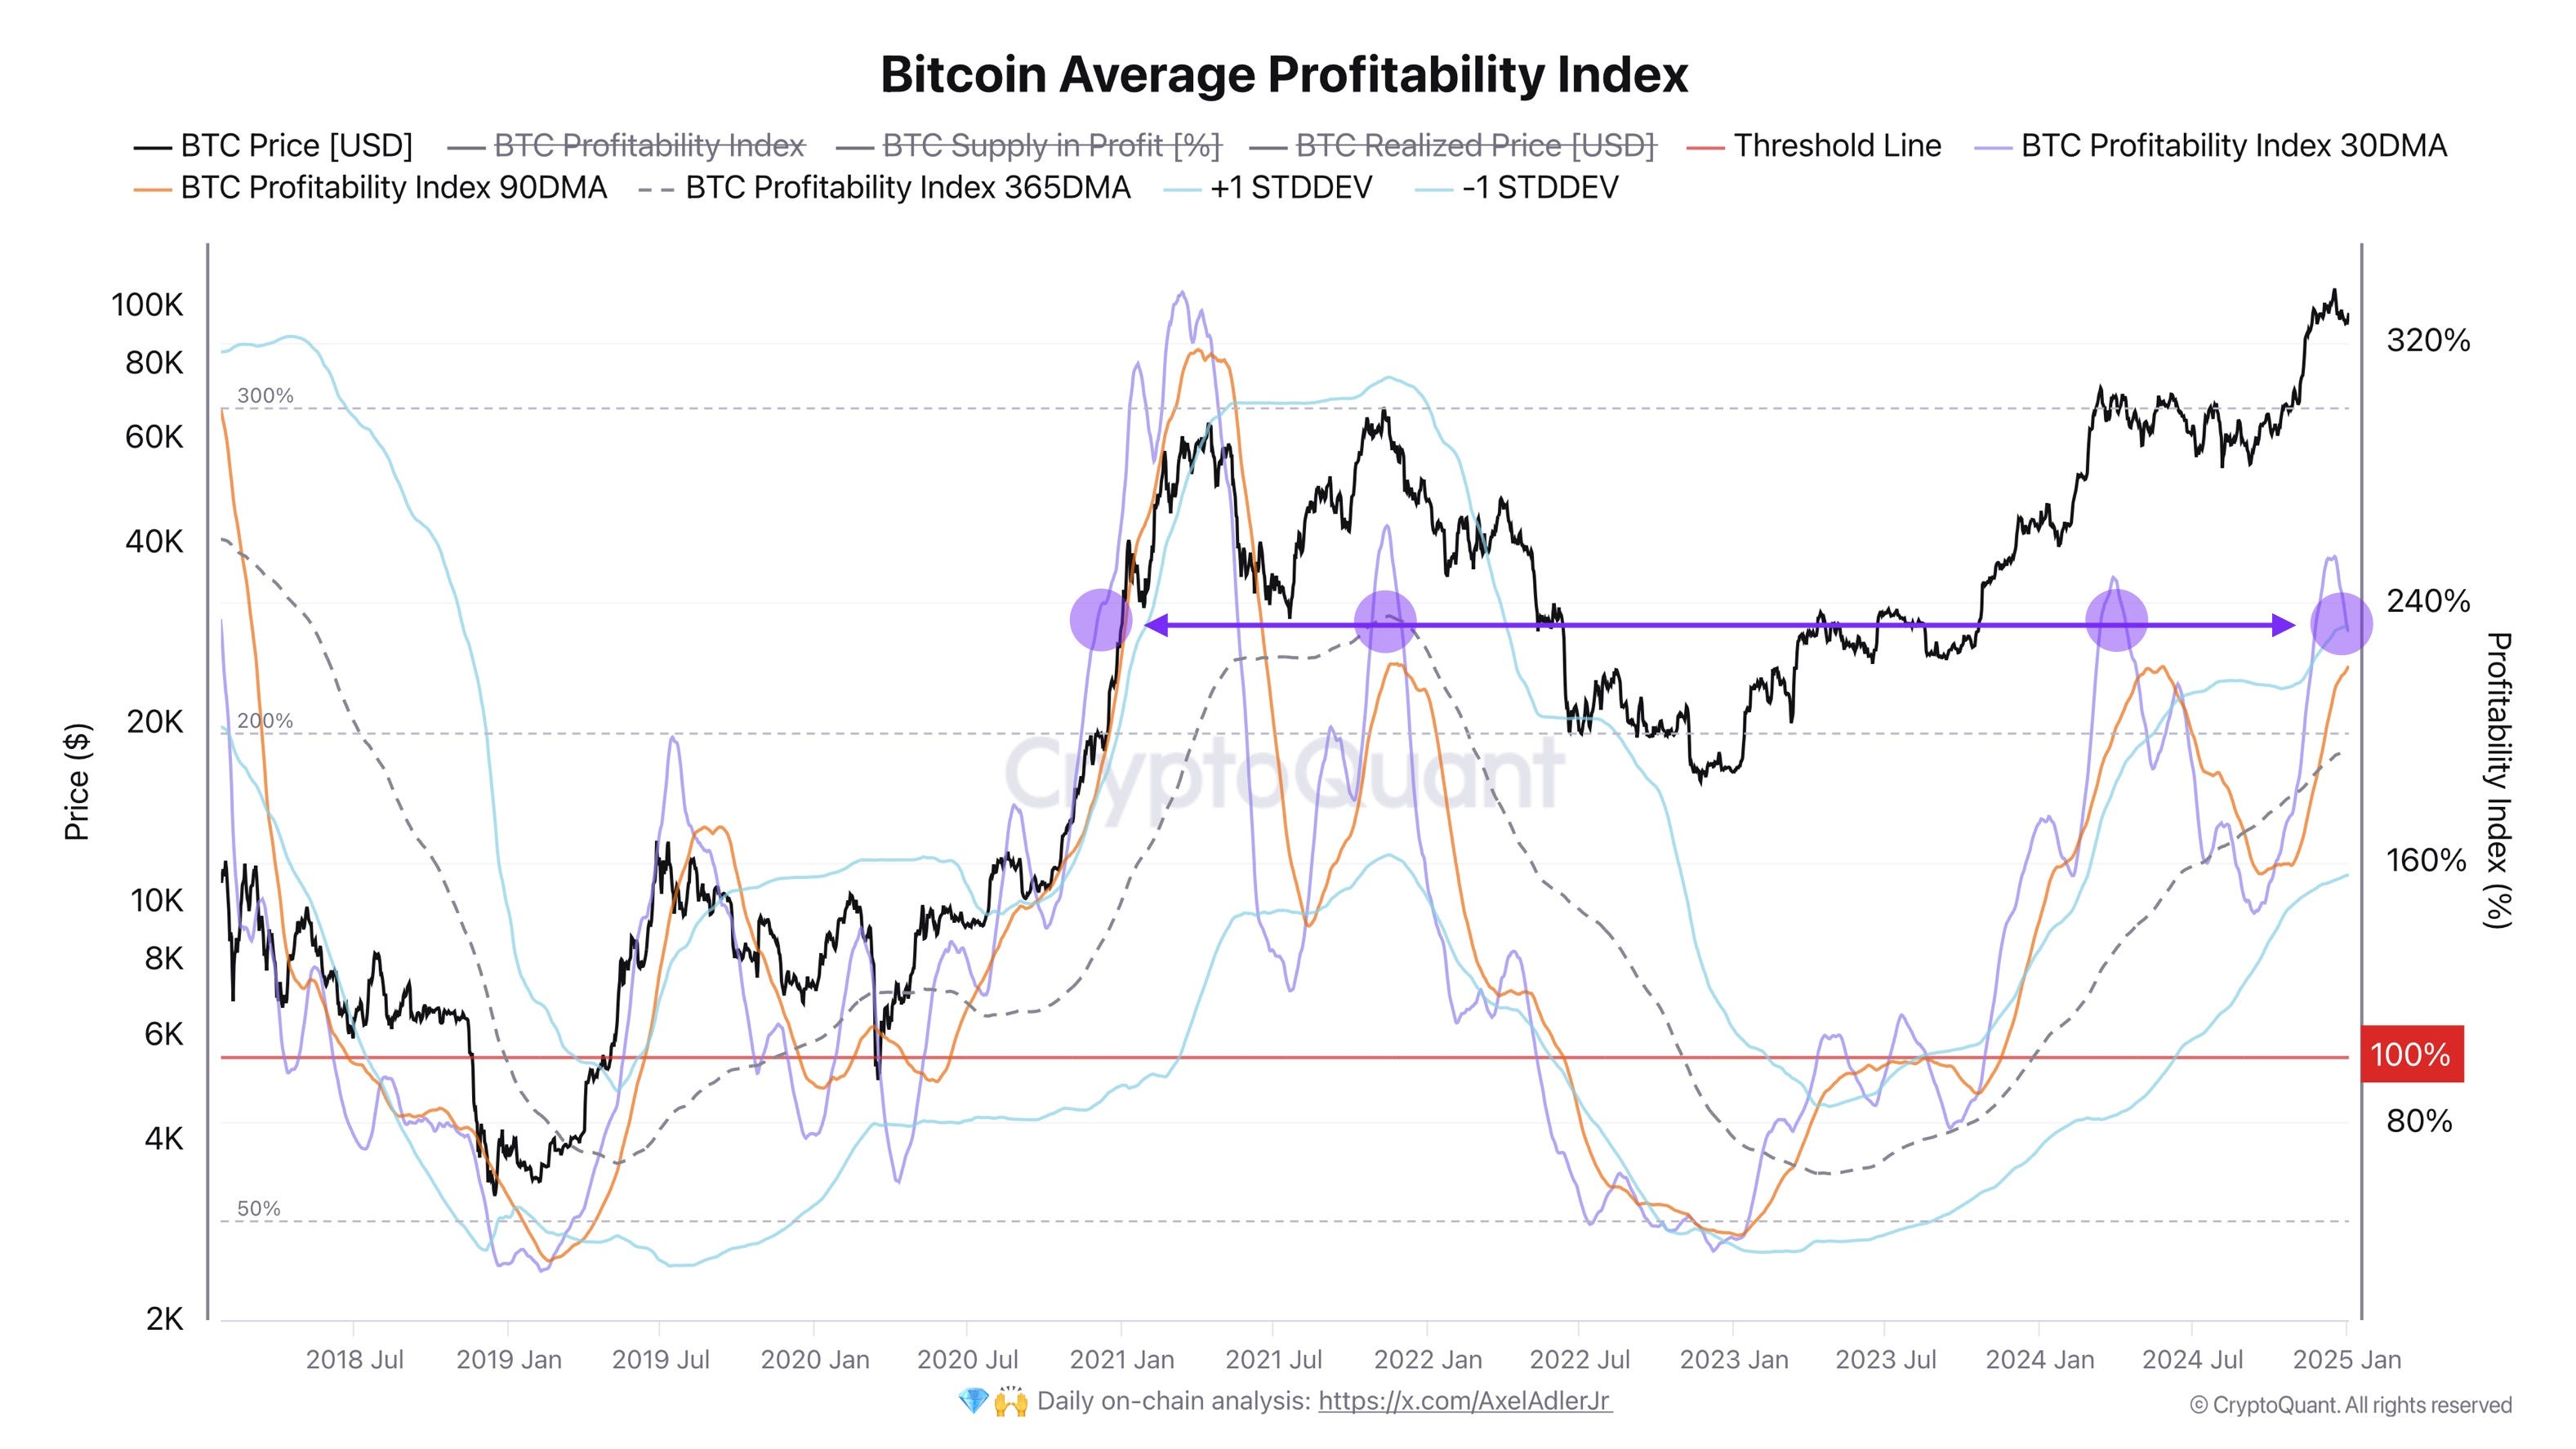
The chart displays the Bitcoin Average Profitability Index (hereafter referred to as the "Index"), which measures how much the current BTC market price is above or below the average purchase price (Realized Price). When the Index equals 100% (or a coefficient of 1), the spot price is equal to the realized price. If the Index is above 100%, most of the supply is in profit, if it is below 100%, most of the supply is in loss.
Based on the trends of the 30-day, 90-day, and 365-day moving averages (represented by different-colored lines on the chart), all three moving averages are above the 100% mark. This generally signals a relatively stable (bullish) phase in the market. Historically, when the Index rises significantly above 200%, the market is often in a growth phase or its late ("mature") stage. The chart shows that extreme peaks (up to ~300% and higher) occurred during the explosive rally of 2021.
When the Index reaches high levels (200–300% or above), there is a high likelihood of increased "profit-taking" by those who are already in significant profit. This can lead to temporary price pullbacks and a cooling of the metric. However, judging by the earlier Bitcoin: Demand Momentum metric, demand for coins remains very high at the moment.
Future price movements will largely depend on how long the market can sustain this level of profitability. If participants begin mass profit-taking, we may see a correction. However, if demand continues to outpace supply, there is potential for further growth.
Conclusions:
The market is cooling after new ATHs: new U.S. regulations enhance transparency for institutional investors, while increased Bitcoin reserves in countries and companies signal further institutionalization. Demand from STH remains strong, with most BTC held above realized price.
Sustaining high profitability levels in the past often led to corrections, but demand currently outpaces supply. A steady bull trend or healthy correction will depend on macroeconomic factors and institutional activity. The current nearest support level is $90K.
Good luck in the upcoming trading week!
Great job. Thanks for sharing mate
very useful information. thanks