Insight #31
Bitcoin in the $94K–$98K range, macro-bearish sentiment, neutral MVRV. Breakout or continued consolidation.
Macroeconomics
1. Retail Sales in the US
Priority: High
Key Data: Retail sales in January fell by 0.9% — the steepest drop in a year, significantly worse than forecasts.
Segment Breakdown: The largest decline was recorded in sporting goods, hobbies, musical instruments, and books (down 4.6%), while sales at gas stations and restaurants rose by about 0.9%. Sales counted in GDP calculations dropped by 0.8%.
Connection to Bitcoin: Slowing consumer spending may signal a reduction in economic activity, often prompting a search for alternative assets like Bitcoin to hedge against fiat risks.
2. Industrial Production in the US
Priority: Medium
Overall Growth: Industrial production in January rose by 0.5%, exceeding expectations of 0.3%.
Sectors and Factors: A notable contribution came from aircraft and parts manufacturing (after a strike was resolved) and utilities (electricity up 6.1% and natural gas up 15.4%). Meanwhile, manufacturing output declined by 0.1% (due to a 5.2% drop in the index for automobiles and components), and mining fell by 1.2%.
Connection to Bitcoin: Mixed signals: positive growth in some sectors can reduce panic, but continued weakness in the manufacturing base maintains uncertainty, periodically boosting interest in Bitcoin as an alternative asset.
3. China – Current Account and Trade
Priority: High
Current Account: A record surplus of $180.7 billion was posted in Q4 2024 — the highest figure on record.
Trade: The goods surplus surged to $249.6 billion thanks to rising exports (+11% to $936.4 billion) and a slight decline in imports (-0.4% to $686.8 billion). Deficits in the services and primary income accounts decreased, while the secondary income account remained stable.
Connection to Bitcoin: Strengthening export demand and shifts in the trade balance may spark concerns over the stability of fiat currencies, increasing Bitcoin’s appeal as a means of diversification and capital protection.
4. Eurozone Economy
Priority: Medium
Growth Rates: In Q4 2024, GDP grew by 0.1% — a weak figure, with the largest economies (Germany and France) showing GDP contractions (down 0.2% and 0.1%, respectively), while Italy remains stagnant.
Positive Aspects: Some countries (Spain, Portugal, the Netherlands, Belgium, Slovenia, Slovakia, and Estonia) demonstrated solid growth.
Annual Figures: The eurozone’s year-over-year growth was 0.9%, and for the entire year, it reached 0.7% (exceeding the 0.4% mark in 2023).
Connection to Bitcoin: Weak growth in the eurozone’s key economies can drive investors to seek alternative assets like Bitcoin for portfolio diversification amid a sluggish traditional economy.
5. Upcoming Events – The Fed and Global Economic Data
Priority: High
US: The release of the FOMC minutes and speeches by Federal Reserve officials will provide crucial signals on monetary policy. Key housing data (building permits, housing starts, existing home sales) and S&P Global PMI are expected, as well as manufacturing activity indexes (NY Empire State Manufacturing, Philadelphia Fed).
Global Outlook: Globally, we expect interest rate decisions in Australia, New Zealand, and China; inflation data for Canada, the UK, South Africa, and Japan; trade balance reports for the eurozone, India, and Japan; as well as additional PMI readings and consumer sentiment reports that could impact short-term market liquidity.
Connection to Bitcoin: The Fed’s monetary decisions and global economic data significantly influence liquidity and risk appetite. Heightened uncertainty or expectations of policy easing can drive increased demand for Bitcoin as a hedge against inflationary and systemic risks.
Important News from the Past Week
1. Governmental and Institutional Initiatives
Priority: High
These developments lay the foundational conditions for the continued growth of the crypto ecosystem. Legislative measures, governmental fund initiatives, and large institutional operations significantly impact regulation, investor confidence, and Bitcoin’s strategic positioning.
- State Street and Citi Bank
The launch of cryptocurrency custody services demonstrates that major American banks are adapting to digital assets following regulatory changes, which bolsters institutional trust.
- Barclays – BlackRock Bitcoin ETF Holdings ($131 million)
Disclosure of holdings confirms rising institutional investor interest in Bitcoin ETFs.
- Abu Dhabi Sovereign Wealth Fund ($436 million in a Bitcoin ETF)
Investments by a sovereign fund illustrate a global trend of public funds investing in cryptocurrencies.
- Wisconsin Investment Board ($321 million in BlackRock’s Bitcoin ETF)
The adoption of crypto investments at the state level signals growing institutional interest.
- Texas – Revision of the Bitcoin Reserve Bill
Legislative changes lift the $500 million limit and open broader opportunities for crypto investments, potentially attracting significant capital.
- US States’ Bitcoin Reserve Bills and National Reserve
The proposal for $23 billion in BTC purchases, along with discussions led by Trump about creating a national Bitcoin reserve, underscores the strategic importance of cryptocurrencies at the government level.
- Goldman Sachs – Ethereum ETF and Bitcoin ETF Holdings
Substantial increases in investments (Ethereum ETF up to $476 million, Bitcoin ETF up to $1.5 billion) indicate large-scale institutional interest.
- Hong Kong – Acceptance of Bitcoin and Ethereum for Immigration Visas
Using cryptocurrencies as proof of net capital enhances their legitimacy and international recognition.
- Michael Saylor’s Strategy
Accumulating 7,633 BTC for $742 million, bringing total holdings to 478,740 BTC valued at $46 billion, underscores an aggressive institutional Bitcoin accumulation policy.
- Missouri Bill HB 1217
A proposal to create a Bitcoin reserve fund for state investments and require crypto acceptance in payments strengthens the integration of crypto assets into public finance.
- Kentucky – Bitcoin Reserve Bill
Being the 16th state with such an initiative could set the stage for a federal-level reserve strategy.
- Florida Senator Joe Gruters
Introducing a bill allowing the state to invest in Bitcoin, capped at 10% of the fund, highlights growing legislative support for cryptocurrencies.
2. Major Corporate Operations and Market Activity
Priority: Moderately High
These updates reflect the dynamics of corporate strategies and market processes, showcasing the revival of demand and the expanding use of crypto assets in the commercial sector.
- Robinhood – Trading Volume Growth
Cryptocurrency trading volume rose by 400% to $70 billion, and crypto-related revenue by 700% to $358 million, pointing to a market rebound and increased interest among retail investors.
- Metaplanet – Inclusion in the MSCI Japan Index
Raising $26 million via zero-interest bonds to purchase more Bitcoin elevates cryptocurrency’s global visibility.
- Trump’s WLFI – Launch of the “MacroStrategy” Fund
A new fund for investing in Bitcoin, Ether, and top altcoins merges traditional finance with decentralized technologies, potentially spurring capital inflows.
- Gaming Company Gumi
Acquiring Bitcoin worth 1 billion yen (about $6.6 million) to expand in Web3 and pursue staking plans demonstrates the integration of crypto assets into corporate growth strategies.
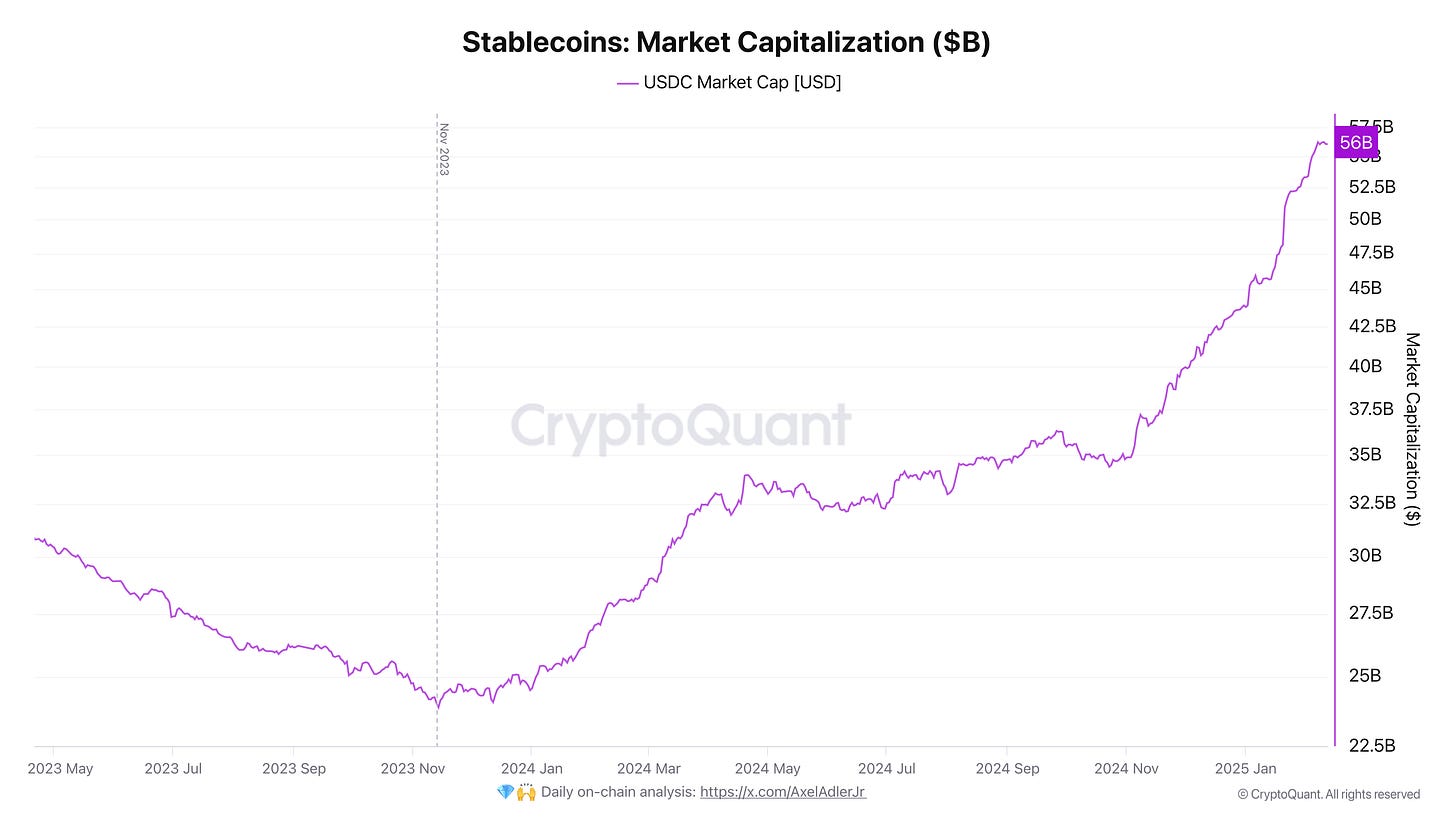
- USDC Market Cap ($56.3 billion)
The stablecoin USDC’s market cap recovery following the bear market highlights its importance, despite USDT retaining the lead—an important factor for crypto market liquidity.
Bitcoin Weekly Macro Analysis
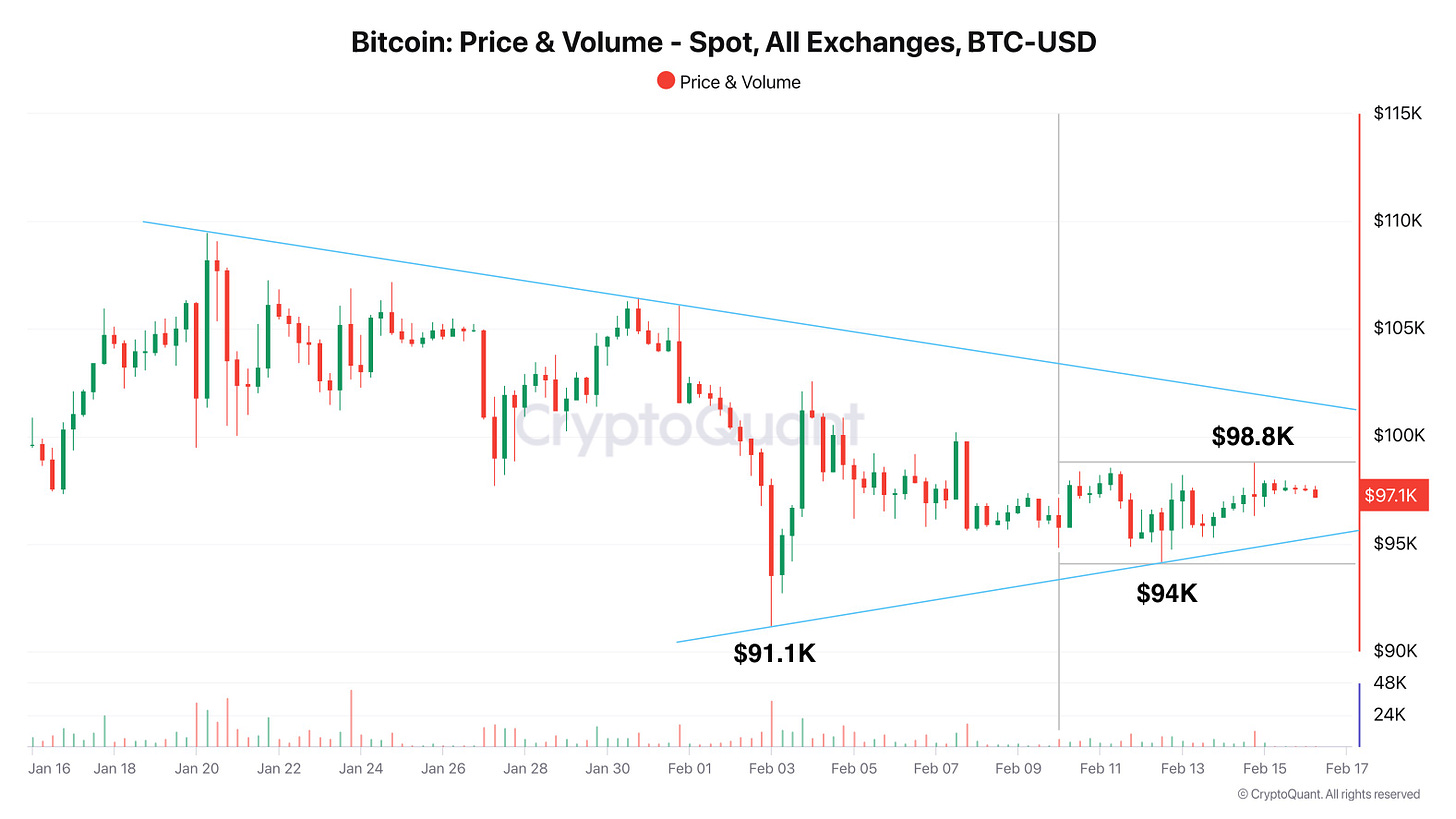
Over the last trading week (February 9–15), BTC showed a pronounced consolidation phase within a narrow price range of $94K to $98.8K, with the latest recorded mark around $97.1K. Chart dynamics indicate the formation of a symmetrical triangle, where the upper boundary (resistance) is gradually descending, and the lower boundary (support) is rising. This setup points to contracting volatility and uncertainty among market participants, who are waiting for a signal to break out of the current range.
Trading volumes remain relatively low, confirming a phase of anticipation ahead of a potential breakout. Throughout the week, the price tested critical support at $94K several times before rebounding, and also approached resistance at $98.8K without breaking through. Under the current sideways movement, a breakout above the upper boundary could trigger an impulsive rally beyond $100K, while a breach of the $94K support could prompt a correction into the $91.1K area or even lower.
Bitcoin: Advanced Sentiment Index
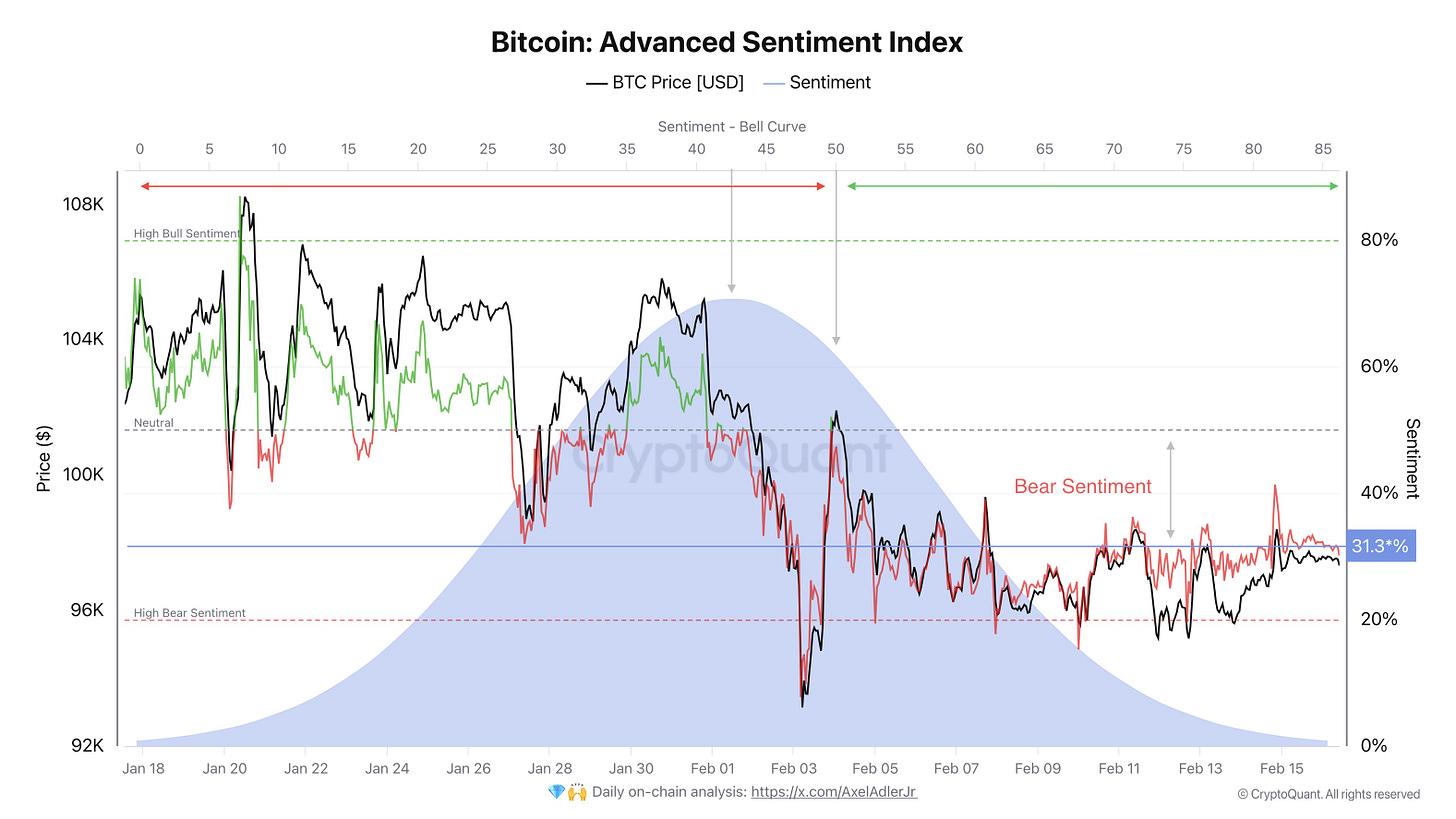
The first metric we’ll examine is the updated advanced Bitcoin sentiment index. It takes into account price (VWAP), Net Taker Volume, Open Interest, and Volume Delta. When the metric falls below 50%, sentiment becomes Bearish; conversely, when it rises above 50%, it becomes Bullish. In the background, there’s a Bell Curve chart showing the most frequent sentiment level over the past month, which is 43%.
The current reading of 31% reflects the overall current bearish sentiment. A breakout above 50% could trigger further accumulation of long positions and strengthen the bullish trend. It’s worth noting that while the current reading (31%) formally indicates a bearish market view in the short term, from a “macro” perspective (medium- and long-term outlook), a move from the 30–40% zone toward higher values can be interpreted as an increase in bullish sentiment.
Together with the Bell Curve (where the most frequent monthly value is around 43%), we can conclude that the market was more often near the neutral zone (around 40–50%). Right now, the indicator is below that range, but if sentiment begins to recover quickly and settles above 50%, that would send a convincing signal to new buyers. Thus, the key level to watch at the moment is 50%. Surpassing it will confirm a shift in sentiment.
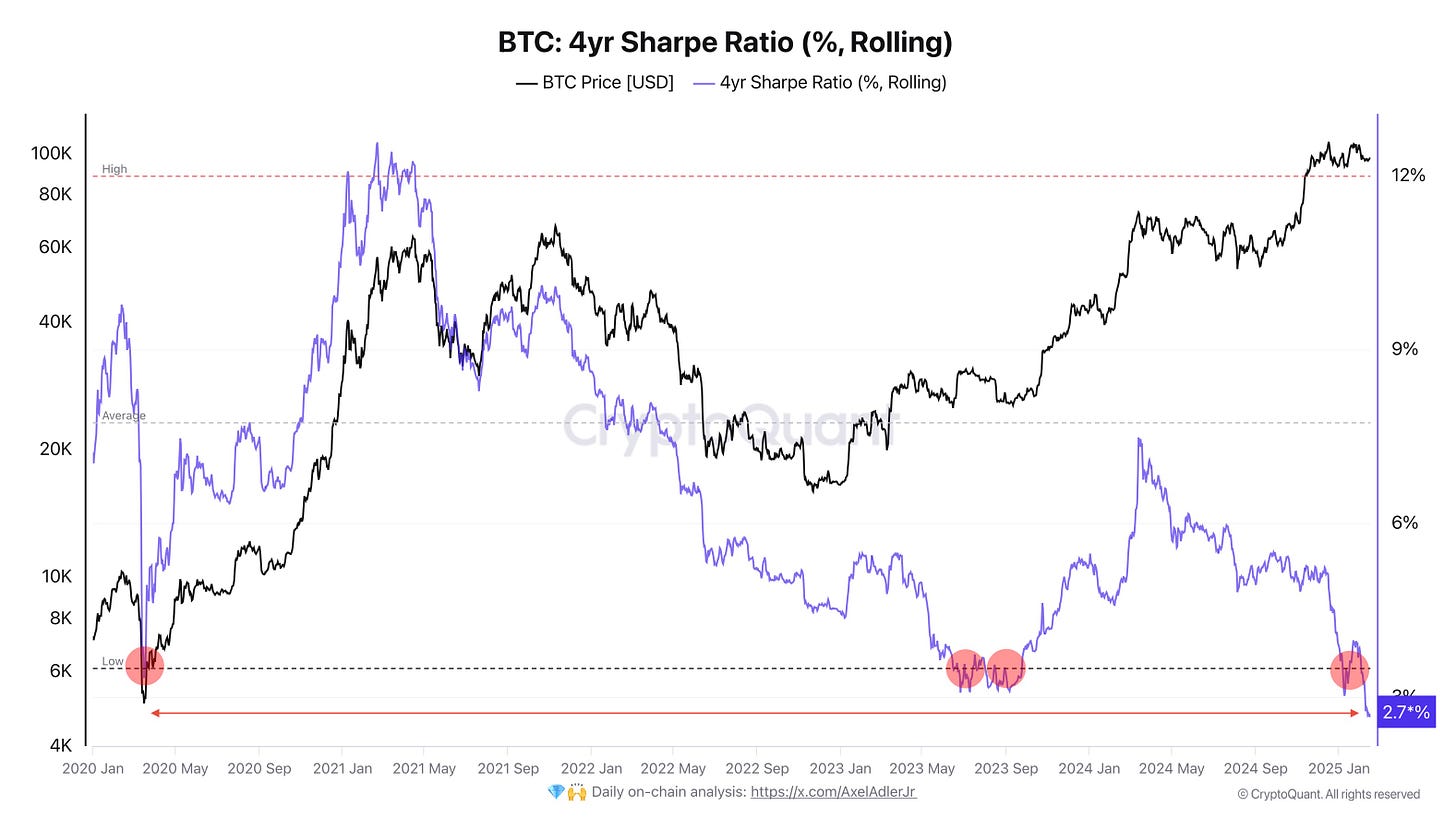
Bitcoin: 4yr Sharpe Ratio (%, Rolling)
Bitcoin’s Sharpe Ratio is currently around 2.7%, as indicated by the purple line in the chart. The Sharpe Ratio measures an investment’s return relative to its risk – in other words, it shows how much return an investor earned for each unit of risk taken. A higher ratio indicates a better return-to-risk relationship. In this case, over the last four years, Bitcoin’s returns have exceeded the risk-free rate (for example, investing in four-year US government bonds at about a 4.55% annual yield) by 2.7%, even after accounting for Bitcoin’s volatility. This figure, the lowest in the past five years, has historically been followed by subsequent Bitcoin price growth—potentially signaling a buying opportunity.
However, it’s important to remember that past trends do not guarantee future results. A lower Sharpe Ratio reflects a decrease in the risk premium relative to volatility, and decisions to buy should be made within a broader context that includes technical analysis, fundamentals, and the overall market environment.
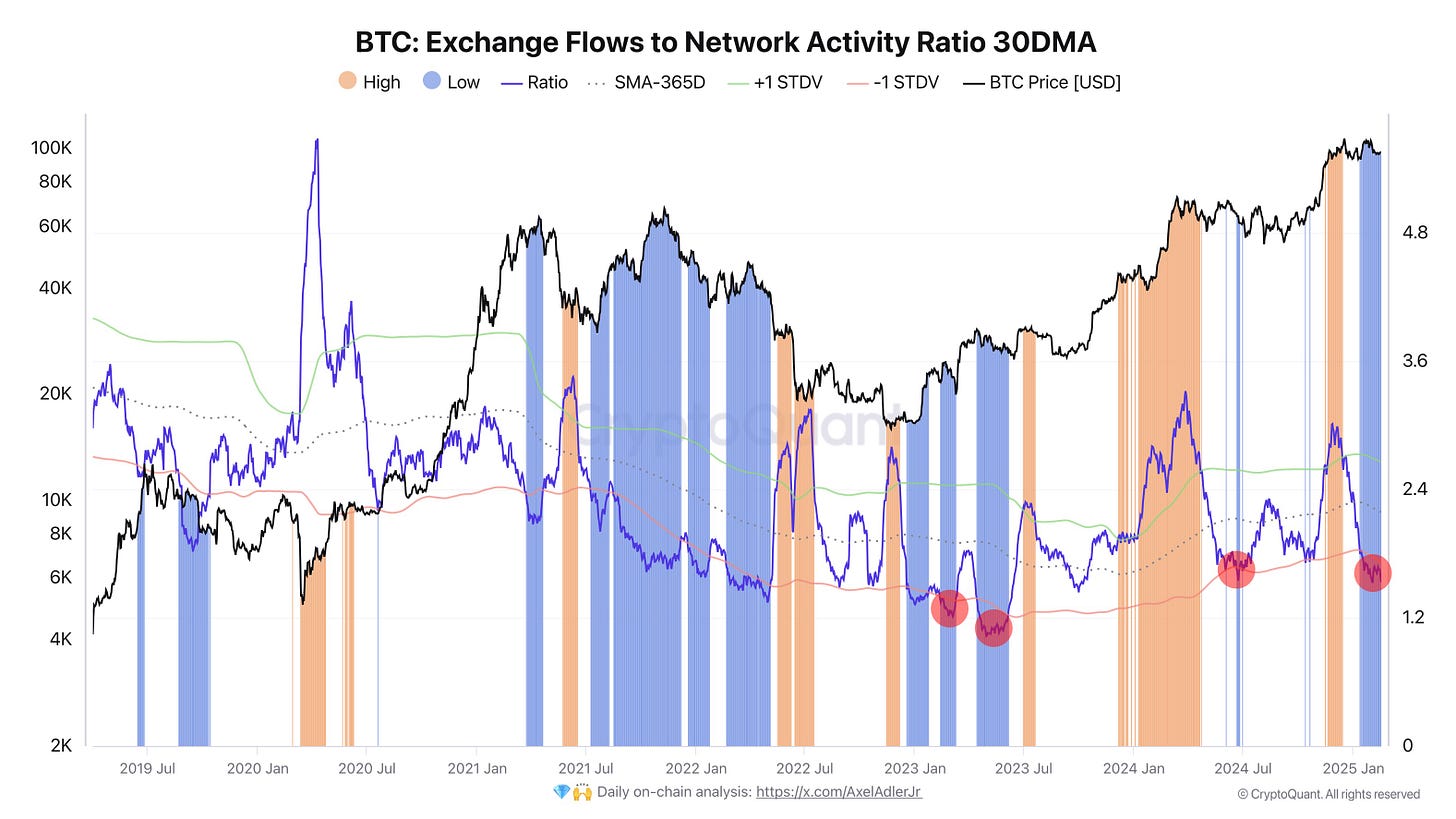
Bitcoin: Exchange Flows to Network Activity Ratio 30DMA
The Exchange Flows to Network Activity Ratio (30DMA) is currently nearing the lower part of its range (marked by blue zones). Historically, these “blue” periods during a bull market coincided with phases of local “oversold” or accumulation conditions, after which Bitcoin typically moved into an uptrend. By contrast, the “orange” zones show when the indicator is at the upper end of its range, hinting at a potentially overheated environment.
Let’s break it down further:
1. What the metric means
- The metric compares BTC inflows to exchanges (Exchange Flows) with overall network activity (Network Activity).
- When the ratio decreases (moving into the “blue zone”), it indicates that fewer coins are being sent to exchanges relative to overall network activity. This often reflects either a lower willingness to sell (fewer coins are put up for sale) or an increase in user/transactional activity without a corresponding rise in coin inflows to exchanges.
2. Why it’s important
- Low values frequently align with periods when the sell-side supply diminishes, and the interest in buying/holding increases. Retrospectively, such moments often coincide with the formation of medium- or even long-term price floors.
- High values, on the other hand, reflect an increase in the flow of coins to exchanges relative to network activity, potentially indicating intensified selling pressure.
3. Current situation
- Based on the chart, the indicator has dropped again into the “lower” zone, where (indicated by red circles) we previously observed potential reversal points. Naturally, this does not guarantee Bitcoin’s price will immediately move upward, but historical patterns suggest an increased likelihood that we are either near or in an accumulation phase.
Taken together, this indicates that the market is likely in a “wait-and-see” mode and a potential accumulation phase. A strongly negative scenario could unfold only if there’s a renewed surge of coins flowing to exchanges—a shift the indicator would quickly reflect by moving into the “orange” zone.
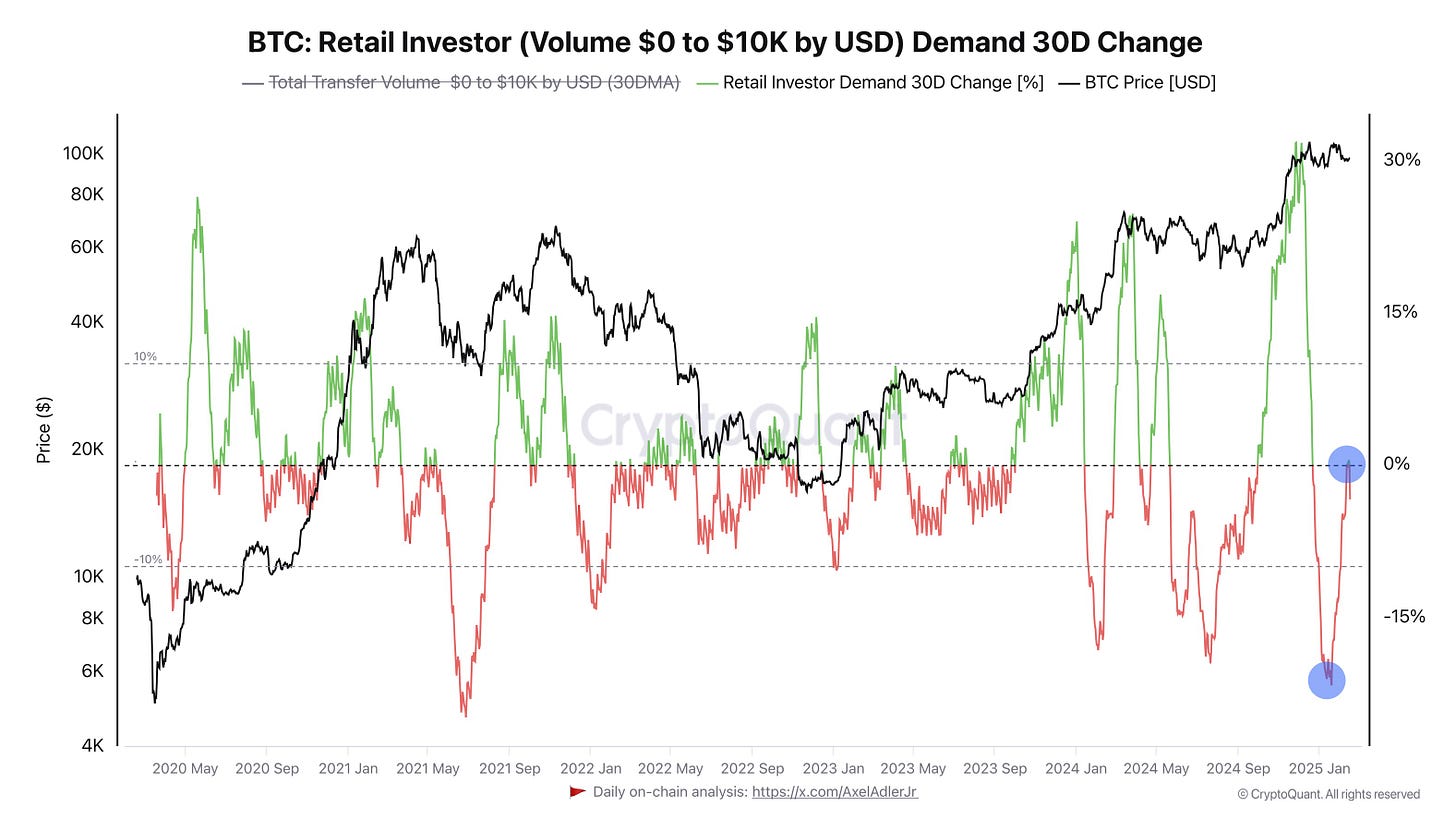
Bitcoin: Retail Investor (Volume $0 to $10K by USD) Demand 30D Change
This chart shows how the 30-day change in the total volume of small-sum transfers ($0–$10K) in Bitcoin (i.e., the retail segment) first dipped sharply into negative territory (–15% and lower), then began to rebound and has now approached around 0% (the area marked with a blue label on the right).
Key observations:
1. Prolonged stay in “negative” territory
- When the 30D Change metric drops below zero, it means that retail participation and small-volume transfers are decreasing compared to the previous month.
- A significantly negative reading (around –15%) indicates a clear outflow or “cooling off” of retail investors. This often accompanies reduced interest, uncertainty, or panic in the market.
2. Current recovery*
- We see that the metric has begun to “climb off the bottom” and has already crossed the zone near 0%, meaning that over the past month, the total volume of small-sum transfers has been rising again compared to the previous 30 days.
- Historically, such “crossovers above zero” from deeply negative readings often coincided with periods of renewed positive sentiment among retail participants.
3. Why this matters
- Retail investors, especially those dealing with smaller amounts, usually enter the market after large players do. Therefore, a surge in “small” investor activity may signal broader interest.
- If the metric remains in positive territory and continues to grow, it could point to increasing “buying pressure” from retail and heightened involvement from a wider audience.
4. What to watch next
- Whether this spike is sustainable: if it doesn’t last and dips back into negative territory, it may indicate that retail is not willing to buy at current price levels or has grown “tired.”
- Correlation with price: in the past, periods of growth in this metric often matched up with the start (or continuation) of an uptrend in BTC. However, if global macro or market conditions worsen, increased participation by small investors might not be enough to prevent a price decline.
Bottom line:
- Over the past month, retail interest has notably revived after a deep slump.
- Historically, a return to 0% and higher can signal a growing inclination among “small” investors to re-enter the market.
- To confirm a genuinely bullish signal, we need to see if the metric remains in positive territory in the coming weeks and is reinforced by other bullish indicators (demand from other segments, overall market momentum, etc.).
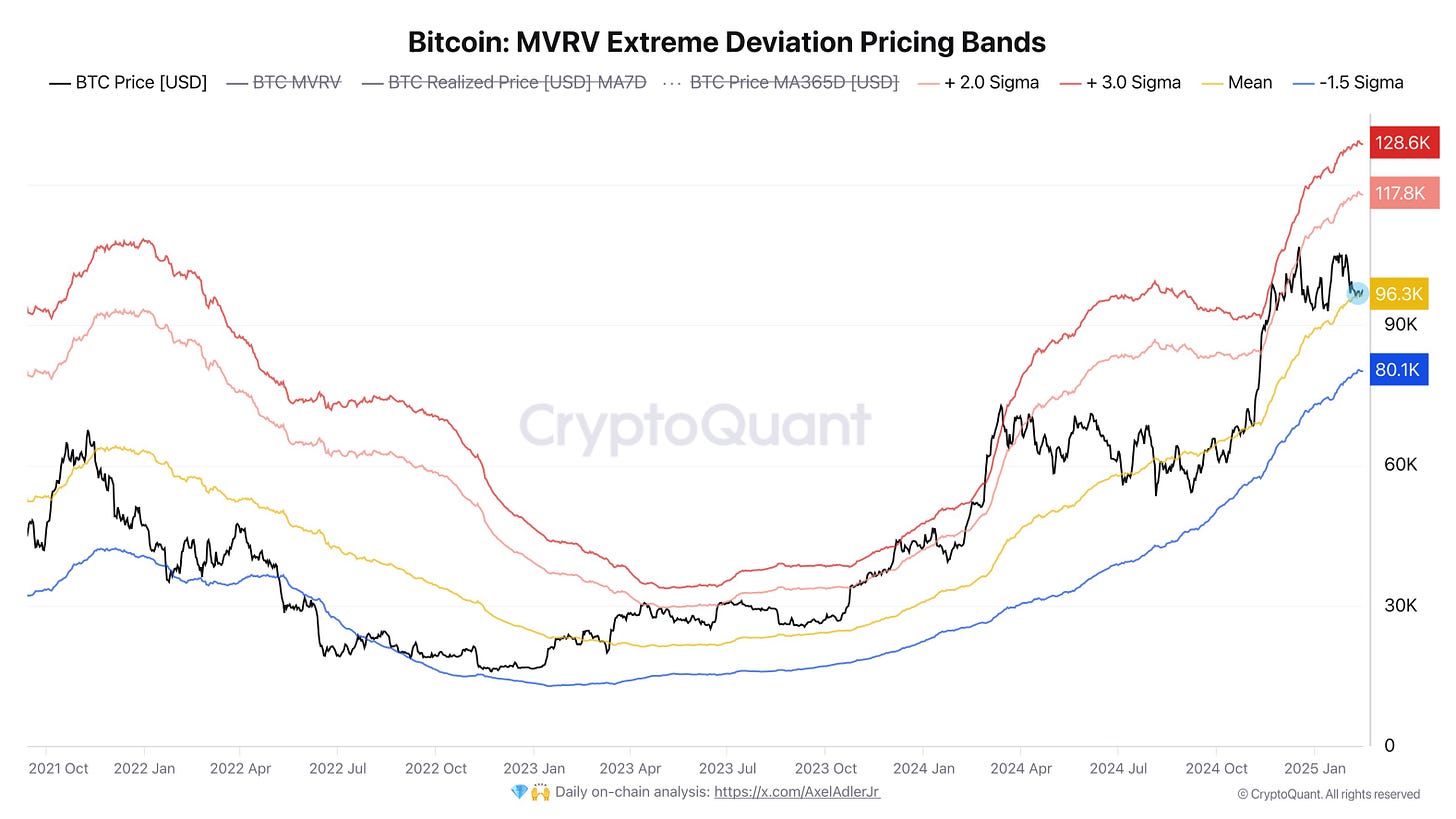
Bitcoin: MVRV Extreme Deviation Pricing Bands
The final metric in today’s review is **MVRV Extreme Deviation Pricing Bands**. This chart shows the so-called **“extreme pricing bands”** based on the MVRV ratio (the ratio of market cap to realized cap). The red lines (upper levels) correspond to the +2σ and +3σ zones, the yellow line is the mean, and the blue zone is around –1.5σ. In simplified terms, this range represents “historically fair” (or even extreme) price levels from the perspective of MVRV.
What we see in recent days (short term):
1. Price is consolidating near the “mean” line
- The black line has approached the yellow line (the average) and isn’t making sharp moves in either direction. This signals a neutral (relative to MVRV) market valuation: Bitcoin is no longer “cheap,” but it’s not overheated either.
2. Key levels above and below
- Above: Should price move into the +2σ or +3σ zone (around ~$117K–$128K at current readings), that would suggest a possibly “overheated” market. Historically, a sharp leap into the upper red bands indicates an elevated risk of correction after a strong rally.
- Below: The “–1.5σ” zone (blue line, around ~$80K on the chart) could serve as “support.” In previous cycles, these levels often saw heightened buyer interest. In the current macro cycle, it’s an extreme support level.
3. Short-term weekly dynamics
- No major breakouts have occurred: the market remains “paused” near the average line.
- This typically signifies a wait-and-see phase, during which large traders and investors evaluate potential catalysts (news, macroeconomic events, regulations, etc.).
- Until the price exits this range (between the mean and the nearest band), we can’t confirm a new impulse.
Short-term conclusion:
- At present, Bitcoin is trading close to the “fair” middle on MVRV, offering no clear signals for a strong move in either direction.
- If a bullish catalyst emerges, we might see a push toward the upper red bands (+2σ / +3σ zone). Otherwise, a drop to the blue band could occur if negative factors intensify.
- Being in the “middle” of the range typically means the market could continue drifting sideways until a clear driver prompts a breakout.
Conclusion
Over the coming week, Bitcoin is likely to remain in a consolidation phase within a narrow range until a definitive macroeconomic or technical impulse prompts a breakout. Key levels remain support around $94K and resistance at $98.8K —breaching either could catalyze further movement, possibly pushing above $100K or correcting below $91K. Additionally, surpassing the critical 50% mark in the sentiment index would be an important signal that could encourage investors to increase their long positions.
On the other hand, global macro data and significant institutional news—such as Bitcoin ETF investments and legislative initiatives—are opening up new possibilities for capital inflows. Combined with recovering retail investor activity, this could set the stage for a shift away from short-term bearish sentiment.
Q1/2025 Forecast
My forecast for the first quarter of 2025 remains at $130K per Bitcoin.
Good luck in the upcoming trading week!
AAJ









A great one!
🤝