
Weekly Engine #101
W3 Jun 2026

GM/GN.
This week, one of the hottest topics on X was Strategy. Let’s break down what is really happening with Michael Saylor and how it could affect the market.
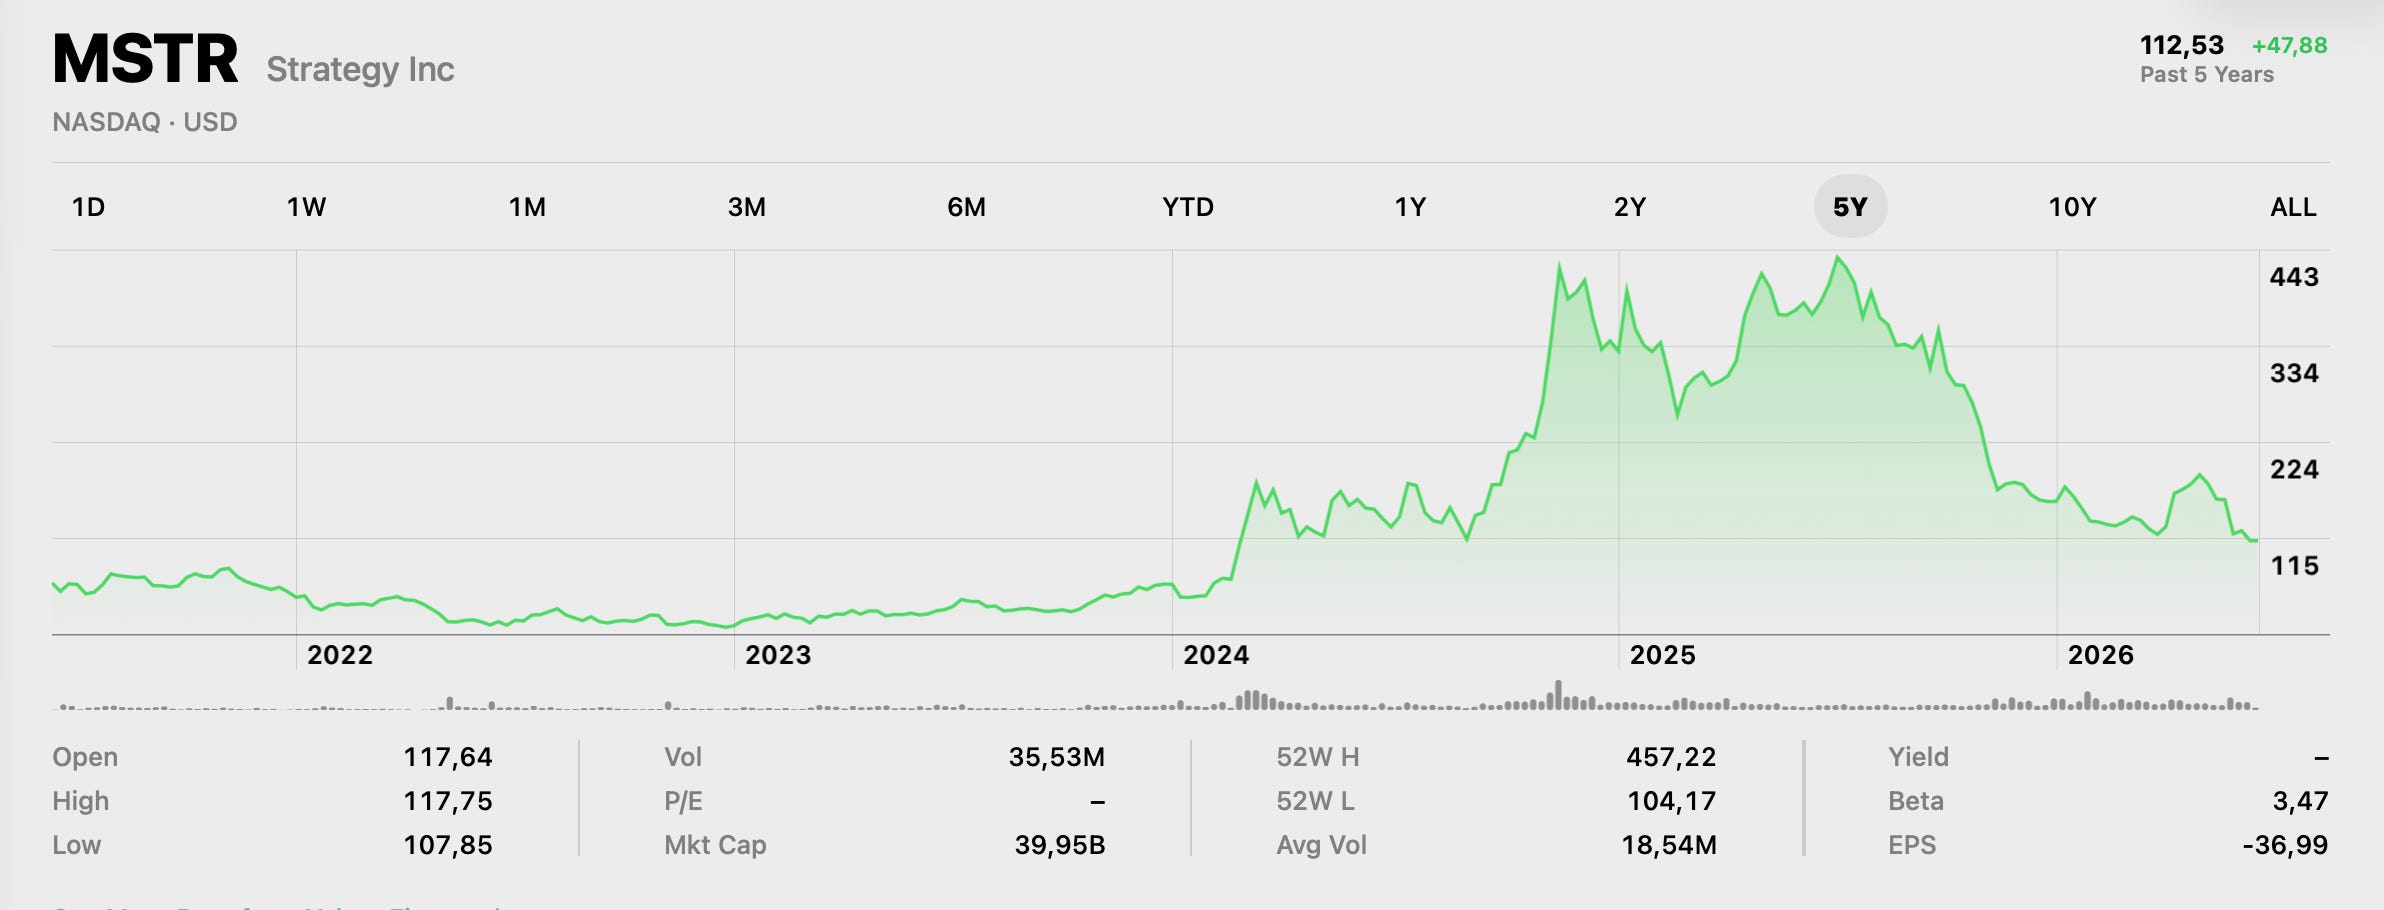
Strategy Inc. (MSTR) is a high-risk stock with leveraged exposure to BTC, a complex debt and preferred-share structure, risk of further dilution, and stress around STRC.
Here is what we see right now: MSTR price $112.53, market cap $39.9 billion, BTC $64,150. Strategy holds 846,842 BTC, purchased for $64.07 billion at an average price of $75,656.
What is an MSTR shareholder actually buying?
MSTR is not a Bitcoin ETF. Strategy itself describes MSTR as “amplified exposure” to Bitcoin, but the company directly warns that owning its stock does not give holders ownership rights or redemption rights to BTC, and that the company is not a spot Bitcoin ETF and does not have a share creation and redemption mechanism to keep the price close to NAV.
The business model now works like this: Strategy issues common stock, preferred shares, and debt, then uses the proceeds to buy BTC. This works when capital can be raised cheaply and above the intrinsic BTC value per share. It breaks when BTC falls, MSTR trades weaker, preferred shares drop below par, and new share issuance starts to look less like a way to increase the value of shareholders’ stake and more like a reduction of their ownership in the company.
The main valuation math
A simple “market cap / BTC value” calculation gives roughly 0.70x: $37.6 billion of market cap against $54.1 billion of BTC. At first glance, that looks cheap. But this is an incomplete metric, because debt and preferred shares stand ahead of common shareholders. After the May repurchase, Strategy reported $6.7 billion of convertible debt and $15.5 billion of notional preferred shares, while the USD Reserve was $1.1 billion on June 14.
Calculation of “Net BTC value to common”:
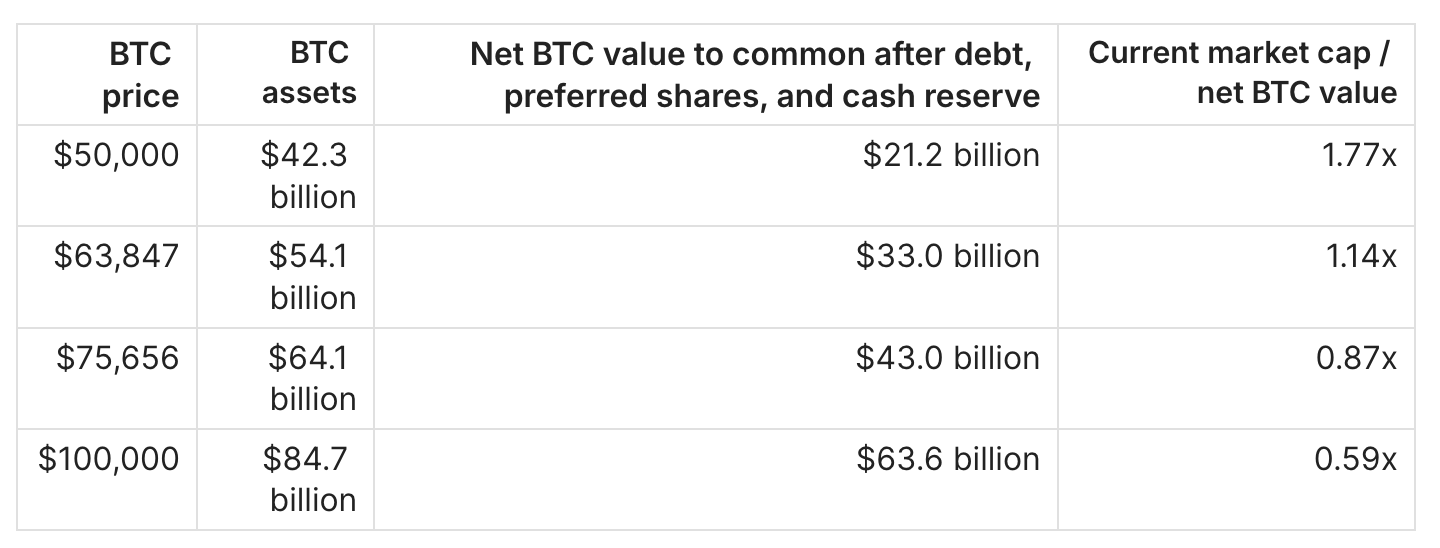
The key takeaway from the table: at the current BTC price, MSTR is not trading at a huge discount to net value for common shareholders. Ignoring the software business, the current market cap implies BTC around $69,300. The software business is not worth zero, but it is small relative to the Bitcoin balance sheet: in Q1 2026, revenue was $124.3 million, while the net loss was $12.54 billion, mainly due to an unrealized loss on digital assets.
Why the situation got worse
The main problem now is not just the drop in BTC, but the fact that Strategy’s whole financing machine has started to creak.
BTC is below the average purchase price. Strategy’s average purchase price is $75,656, while the current BTC price is $64,150, so the market does not see “a huge balance-sheet profit”, but a large floating loss relative to cost basis.
The STRC preferred lost stability. STRC fell below $83 and closed at $88.59. This matters because Strategy’s ability to issue STRC near par was part of the cheap financing mechanism for BTC purchases.
The cost of capital has risen. STRC has a dividend rate of 11.50% for June 2026, and when the price is below par, the effective yield becomes even higher. The lower STRC trades, the more expensive it becomes for Strategy to finance new BTC purchases through preferred shares.
The company has already sold a small amount of BTC. On June 1, Strategy reported the sale of 32 BTC for $2.5 million, with the proceeds intended to fund preferred-share payments. The size of the sale is tiny relative to 846,842 BTC, but symbolically it breaks the old narrative of “we only buy, we do not sell.”
New share sales are putting pressure on shareholders. From June 8 to June 14, the company sold 1,732,553 MSTR shares and raised $209 million, while buying 1,587 BTC for $100 million. The remaining capacity under the MSTR issuance program is $25.75 billion, meaning the company can continue selling new shares, while existing shareholders’ ownership stake in the business gets smaller.
What is positive
There is a positive scenario, but it is almost entirely tied to BTC and the recovery of financing conditions. If BTC moves back above Strategy’s average purchase price and markets again allow the company to issue stock or preferred shares on favorable terms, MSTR can once again become a “BTC flywheel”: issuing securities, buying BTC, increasing BTC per share, rebuilding confidence, and issuing again. The company also reduced debt by repurchasing $1.5 billion of 2029 notes for $1.38 billion, lowering total convertible debt from $8.2 billion to $6.7 billion.
The software business is alive, but it is not the main driver of valuation: Q1 2026 revenue rose to $124.3 million, gross profit was $83.4 million, but the full scale of the financial result is overwhelmed by BTC revaluation.
What is negative
MSTR is the junior layer of the capital structure. Creditors and preferred shareholders stand ahead of common shareholders. Strategy itself warns that buying BTC with debt or preferred shares can increase BTC-per-share and BTC Yield, while also increasing senior claims on assets, which those metrics do not reflect.
Liquidity risk is also real. Strategy directly states that BTC is less liquid than cash, that BTC does not generate cash flow, and that a decline in the BTC price could harm its financial condition and results.
Another risk is accounting volatility. After BTC is accounted for at fair value, changes in the BTC price flow through the income statement. In Q1 2026, the unrealized loss on digital assets was $14.46 billion, which caused the company to report a massive net loss.
How this could affect BTC over the next quarter
For BTC, this does not look like an immediate forced selling scenario. Strategy still holds a huge Bitcoin balance, and the sale of 32 BTC was symbolic in size. But the market will now look at MSTR not as an endless buyer, but as a structure with debt, preferred shares, dividends, and dependence on access to capital.
The main risk for the next quarter is the disappearance of the “Saylor bid”. If STRC stays below par, the cost of capital rises, and MSTR trades weakly, it becomes harder for Strategy to issue securities and buy BTC at the same pace. This does not necessarily create direct selling pressure, but it removes an important source of demand on pullbacks. For the market, that means weaker support during declines and a more nervous reaction to any new BTC sales from Strategy.
The conclusion is that the impact on BTC over the next quarter is likely moderately negative, but not catastrophic. As long as BTC stays below Strategy’s average purchase price of $75.6K, MSTR will amplify volatility and weigh on sentiment. If BTC moves back above $75K-$80K and STRC stabilizes around $100, the risk can fade quickly and Strategy can again become a bullish factor. But until that happens, MSTR is not a source of strength for the BTC market, but an additional layer of risk.
BTC US ETF Flow Monitor
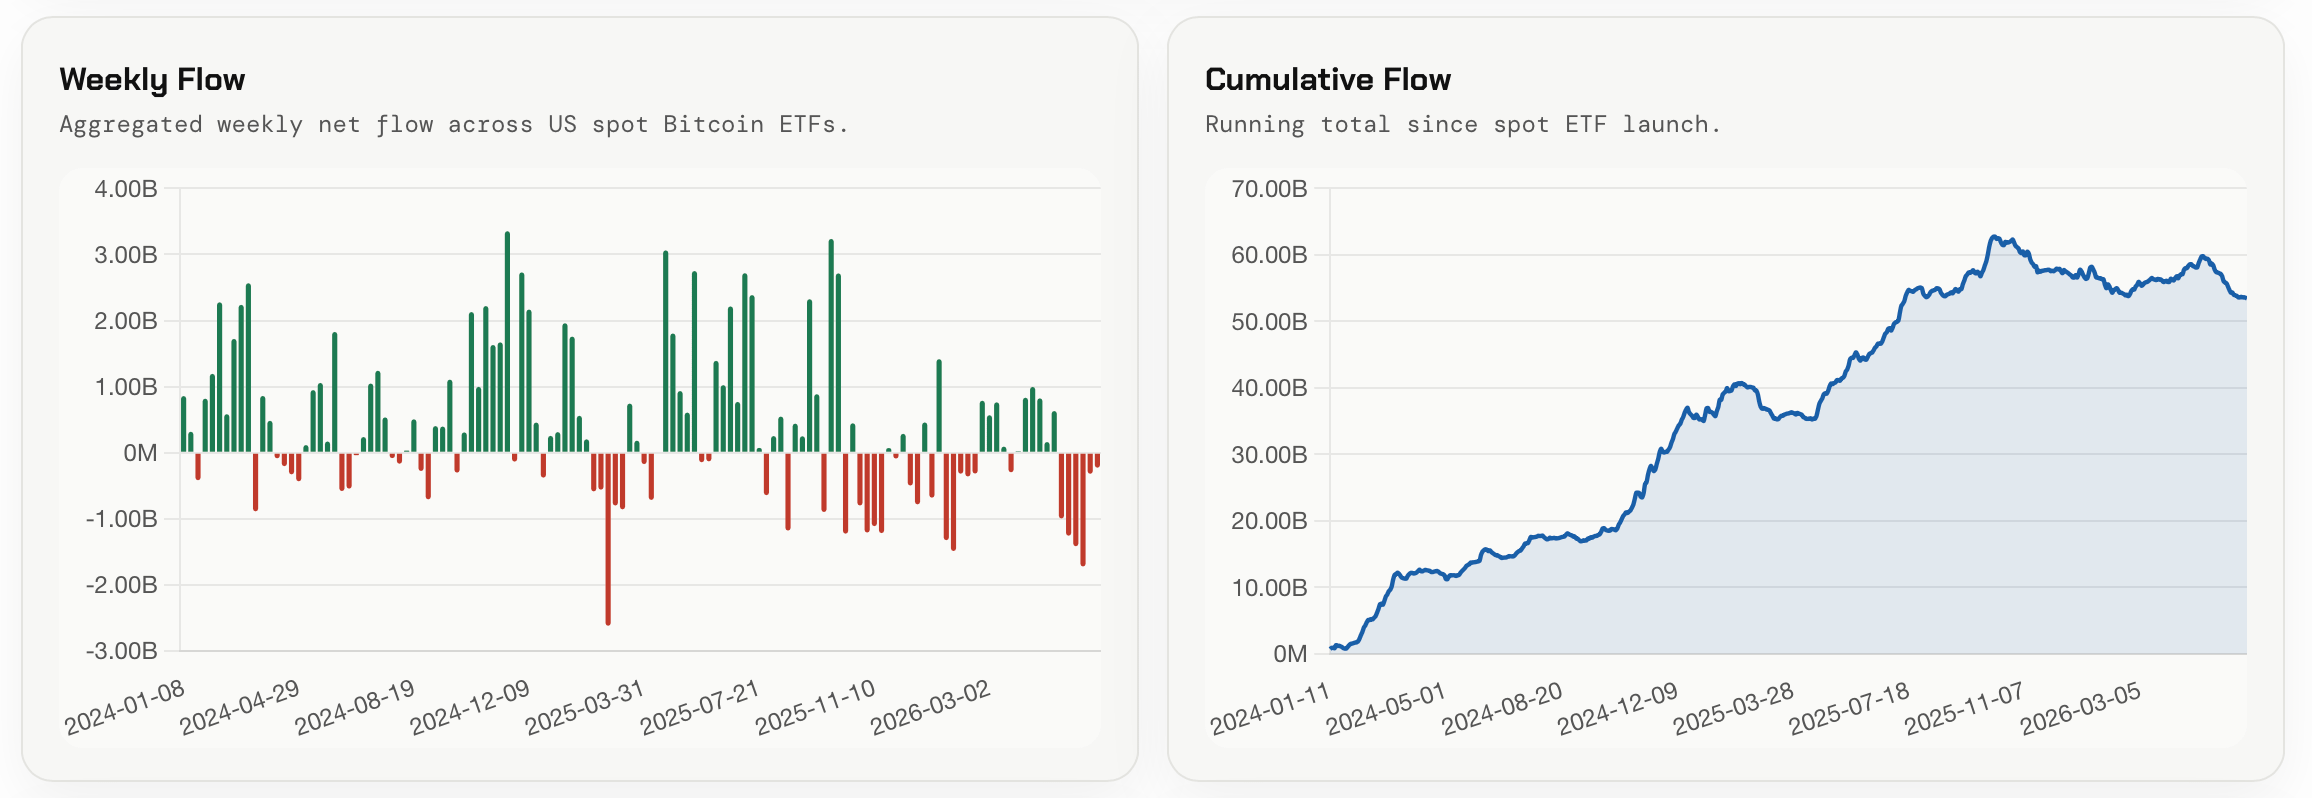
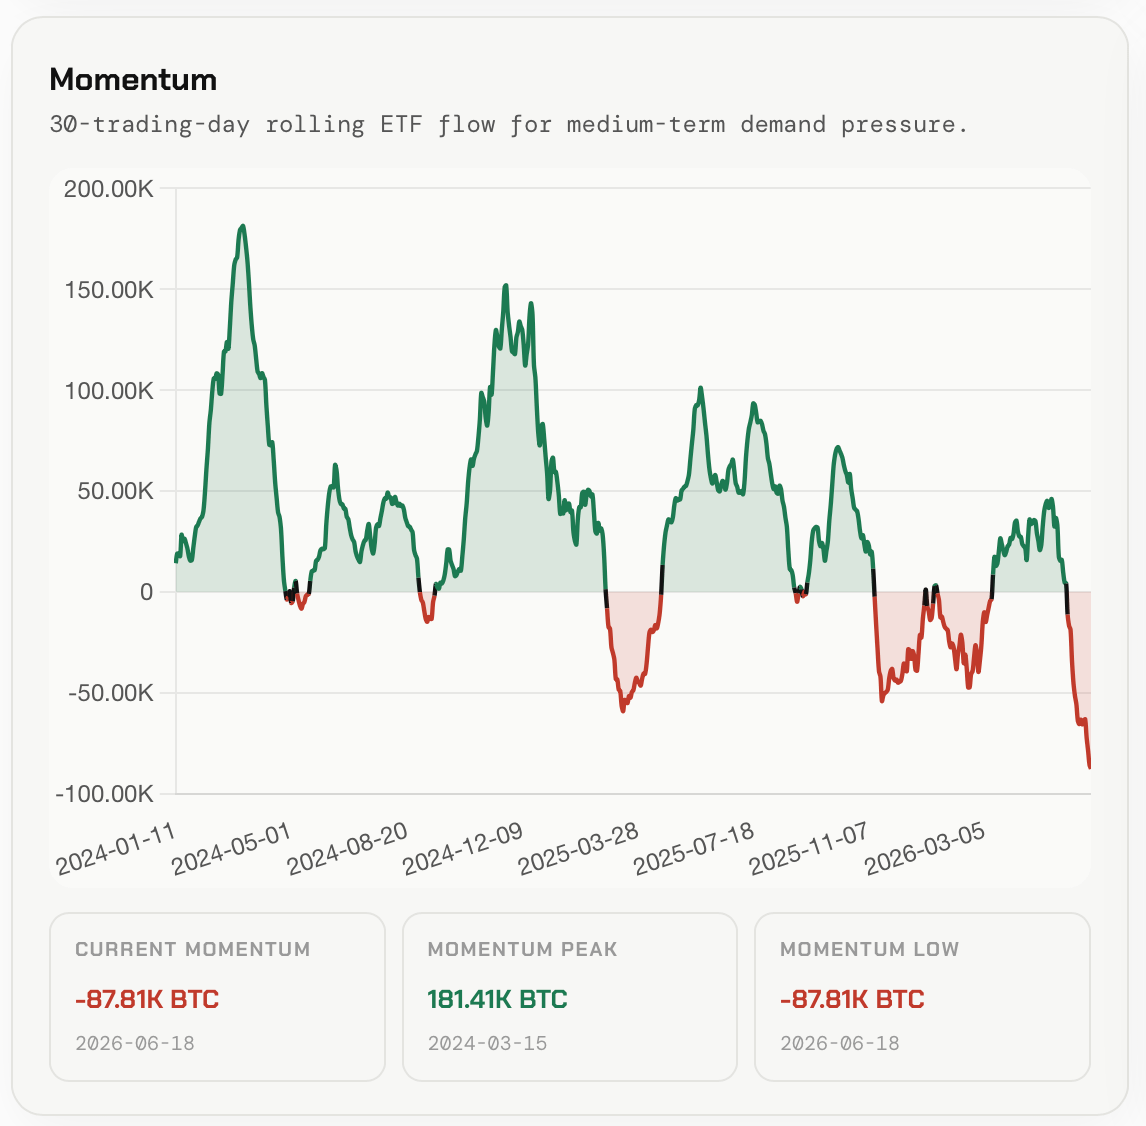
Let’s also look at the ETF market to assess the scale of the corporate segment. US BTC ETF flow remains in a zone of heavy outflows. The 30-day Rolling Flow fell to -87.81K BTC, a new low for the entire period. Over the past 4 weeks, the total outflow was -53.72K BTC, with every week negative. The latest week was less aggressive, but the sign is still red.
Pressure from ETFs has eased compared with the worst weeks, but demand has not recovered yet. For BTC, this means the market is still holding without support from the institutional ETF channel. For the structure to become stronger, we need to see Rolling Flow return above zero and several weeks of sustained inflows.
Decision Terminal

From our internal updates: this week, Decision Terminal was updated to version v1.8. The terminal now includes the Weekly Engine tab and historical data. Through the date dropdown menu, you can now select any past week, for example the week of the previous cycle bottom, and compare the market structure then with the current market situation. I also recommend reading the latest educational post, How Weekly Engine helps identify the Cycle Bottom. It breaks down the Weekly Engine dashboard functionality in detail and shows how to use it to analyze market phases.
🔸
Now to the main part: let’s move on to the weekly breakdown. What is the market showing, which signals have switched on, what new triggers appeared, and what verdict does Weekly Engine give for Bitcoin right now?
The full breakdown is below.
Keep reading with a 7-day free trial
Subscribe to Adler Insight 💎 Premium to keep reading this post and get 7 days of free access to the full post archives.